Fig. 2.
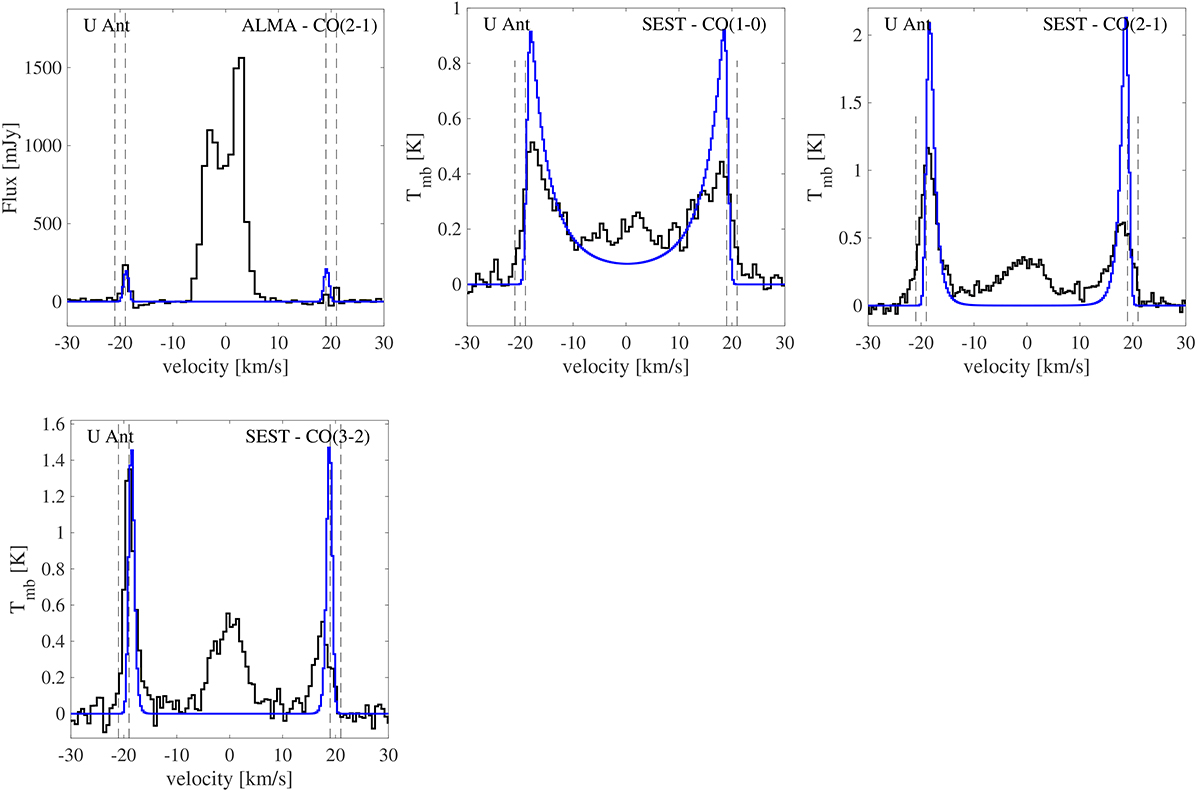
Download original image
ALMA and single-dish observations and the corresponding models (blue lines) for U Ant, based on the values presented in Table 3. The top left panel shows the spectrum of the 12CO (2 − 1) emission extracted from the ALMA data centred on the star, extracted from an aperture corresponding to ≈10% of the shell diameter. The telescope and CO transitions for the single-dish data are indicated in the respective panels. The shell expansion velocities are indicated with vertical dashed lines and are used as input for the shells in Fig. 1, right column.
Current usage metrics show cumulative count of Article Views (full-text article views including HTML views, PDF and ePub downloads, according to the available data) and Abstracts Views on Vision4Press platform.
Data correspond to usage on the plateform after 2015. The current usage metrics is available 48-96 hours after online publication and is updated daily on week days.
Initial download of the metrics may take a while.