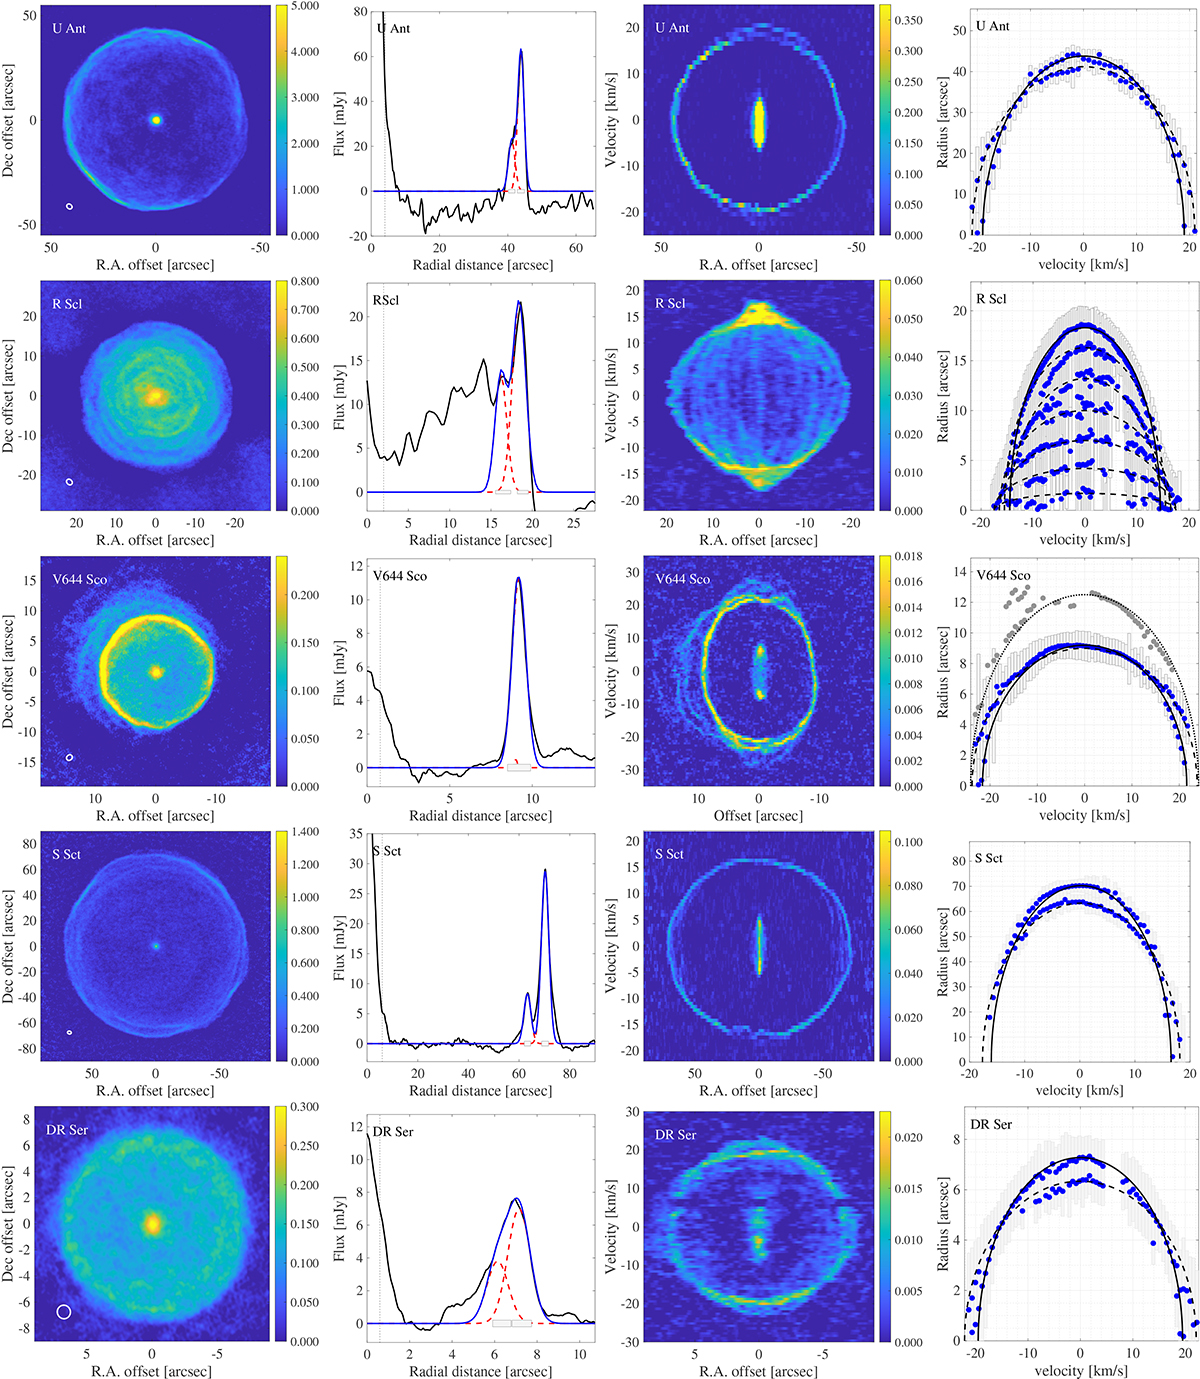
Fig. 1.
Download original image
Visualisations of the detached shells based on the ALMA data. Left: moment 0 maps of the 12CO (1 − 0) emission observed with ALMA (except U Ant – 12CO (2 − 1)). The colour scale is given in Jy beam−1. For each row the source is indicated in the top left corner. The beamsize is indicated by the ellipse in the lower-left corner. Middle-left: AARPs of the shells at the vLSR. The blue line shows the sum of two Gaussian shells (red dashed lines) with the parameters given in Table 3. The vertical dotted line indicates the radius of the aperture that was used to extract the ALMA spectrum (corresponding to ≈10% of the shell diameters). For U Ant the negative flux indicates artefacts owing to insufficient feathering of the total-power data with the main-array observations. Middle-right: position-velocity diagrams in the RA direction at Dec-offset 0 (except V644 Sco at a position angle of 135° to emphasise the structure outside the detached shell). The color scale is given in mJy beam−1. Right: radii of Gaussian fits to the azimuthally averaged radial profiles vs. velocity. The grey-shaded area shows the FWHM of the Gaussian fit. The black and dashed lines show the expected radius vs. velocity for the shells as determined in the AARPs and the spectra.
Current usage metrics show cumulative count of Article Views (full-text article views including HTML views, PDF and ePub downloads, according to the available data) and Abstracts Views on Vision4Press platform.
Data correspond to usage on the plateform after 2015. The current usage metrics is available 48-96 hours after online publication and is updated daily on week days.
Initial download of the metrics may take a while.