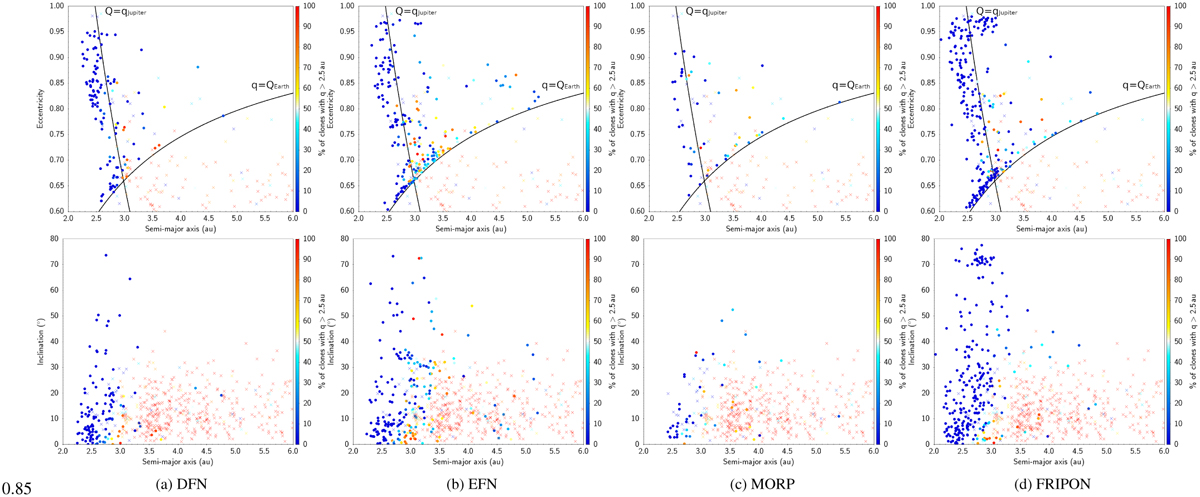
Fig. 9
Download original image
Semi-major axis (au) versus eccentricity and inclination (°) for fireballs observed by each network, along with 661 JFCs from the NASA HORIZONS database. The plot’s color scheme represents the outcome of 10 kyr simulations, indicating the percentage of clones per object that underwent significant gravitational interactions with Jupiter, sufficient to increase their perihelion distance to at least 2.5 au. This perihelion distance is critical as it delineates the inner boundary where cometary activity can commence, with water ice starting to sublimate. Objects colored closer to red in this plot suggest a higher dynamical affinity with typical JFC behavior.
Current usage metrics show cumulative count of Article Views (full-text article views including HTML views, PDF and ePub downloads, according to the available data) and Abstracts Views on Vision4Press platform.
Data correspond to usage on the plateform after 2015. The current usage metrics is available 48-96 hours after online publication and is updated daily on week days.
Initial download of the metrics may take a while.