Fig. 7
Download original image
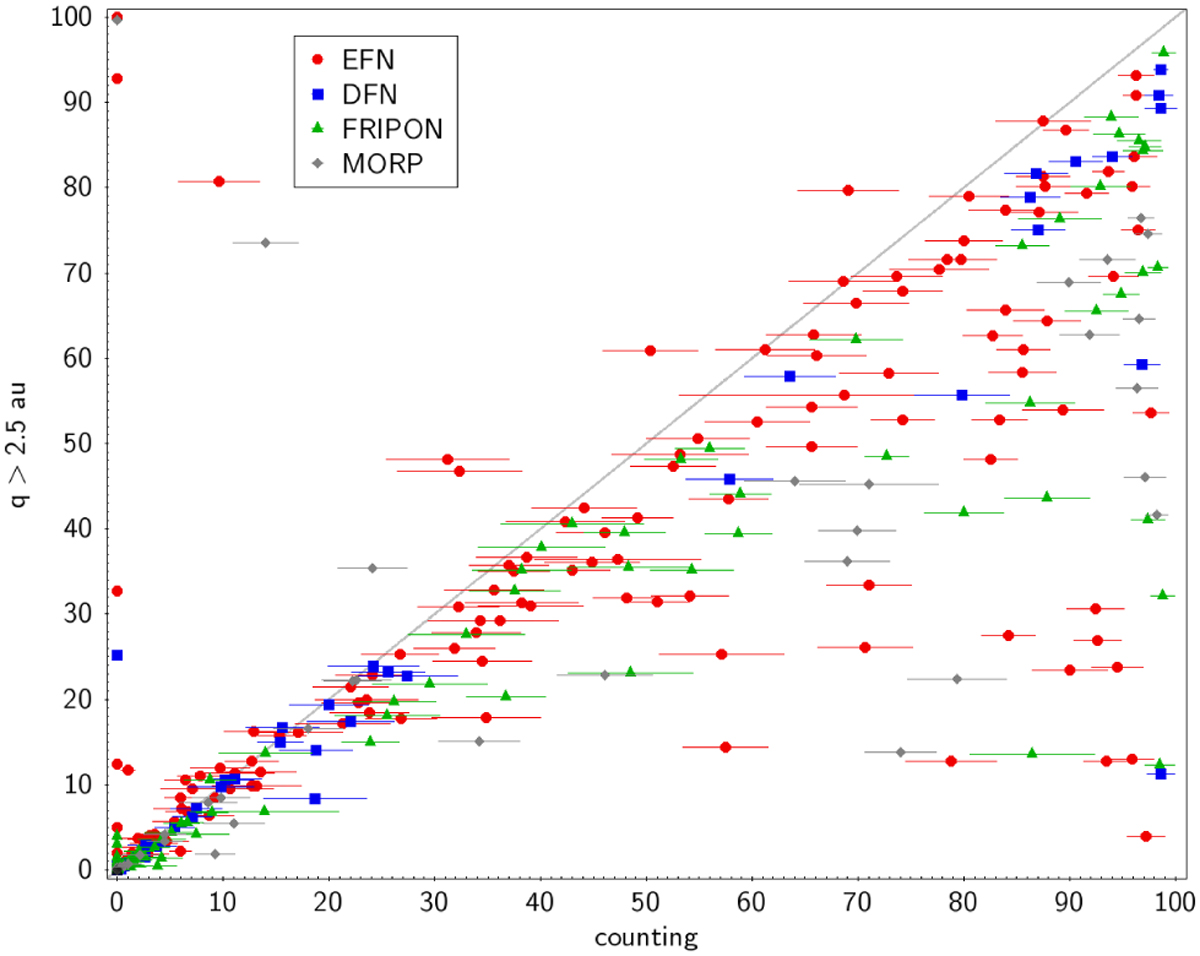
Scatter plot comparing the manual counting method of reviewing integration particle clones histories versus the more simplistic method of identifying the percentage of particle clones that reach a minimum perihelion value of 2.5 au at least once during the 10 kyr integrations. The uncertainties of the manual counting method correspond to the standard deviations of the sample means. For each meteoroid, 10 samples of 100 particles were independently counted to gauge the variation in the manual reduction. The line depicts a perfectly 1:1 relationship.
Current usage metrics show cumulative count of Article Views (full-text article views including HTML views, PDF and ePub downloads, according to the available data) and Abstracts Views on Vision4Press platform.
Data correspond to usage on the plateform after 2015. The current usage metrics is available 48-96 hours after online publication and is updated daily on week days.
Initial download of the metrics may take a while.