Fig. 22
Download original image
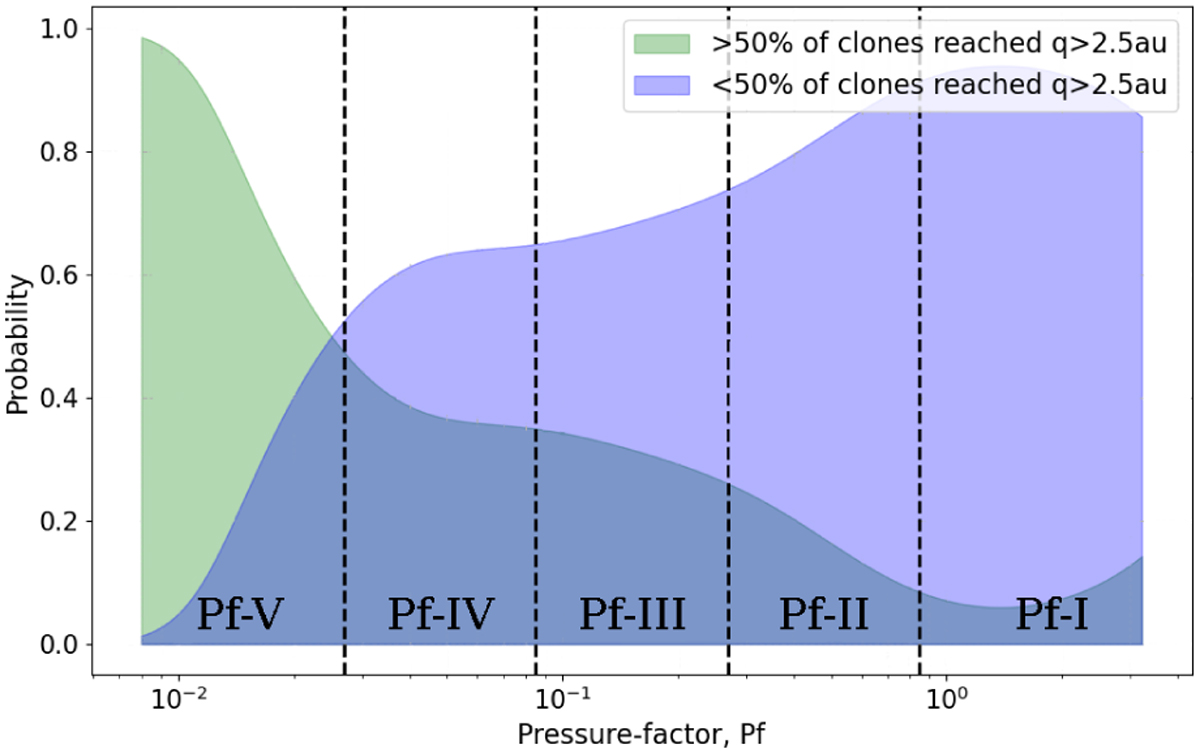
Normalized probability density functions of Pf values for EFN meteoroids on JFC-like orbits, segmented into those with more than 50% and less than 50% of clones reaching q > 2.5 au. The bold vertical lines at Pf values of 0.85, 0.27, 0.085, and 0.027 are the limits for the Pf classes. The probabilities sum to 1.0 for each Pf value, emphasizing the comparative likelihood of belonging to either distribution (seen in Fig. 21a) and providing a probabilistic framework for understanding meteoroid origins in the context of strengths. While the distributions are significantly different, their overlap does not make Pf values a good discriminating mechanism between the stable and unstable comet-like meteoroids in the dataset.
Current usage metrics show cumulative count of Article Views (full-text article views including HTML views, PDF and ePub downloads, according to the available data) and Abstracts Views on Vision4Press platform.
Data correspond to usage on the plateform after 2015. The current usage metrics is available 48-96 hours after online publication and is updated daily on week days.
Initial download of the metrics may take a while.