Fig. 18
Download original image
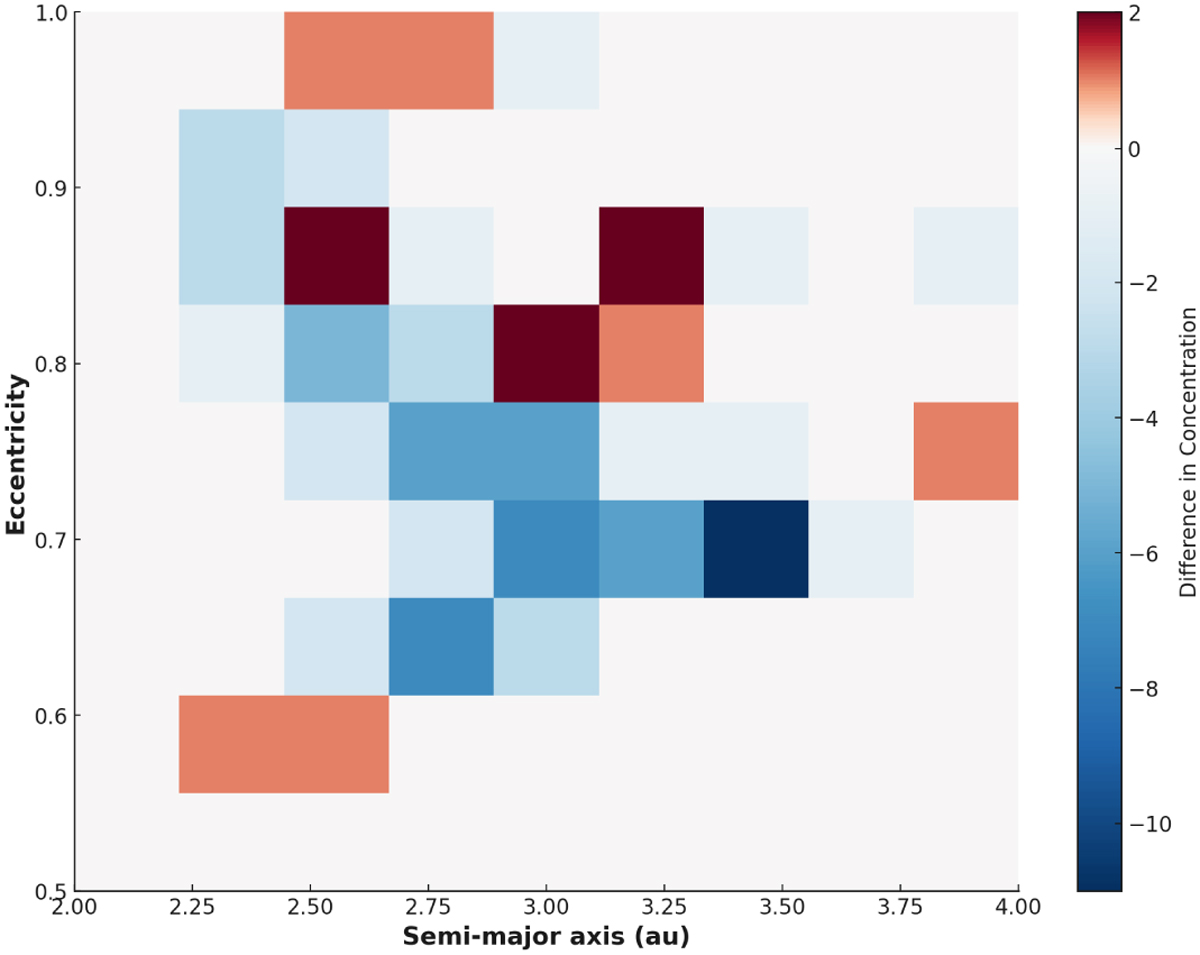
Semi-major axis (au) versus eccentricity heat map, marking the differences in concentration of fireballs detected by the EFN on JFC-like orbits (Borovička et al. 2022b) for fireballs of less than one second and greater than one second. Blue areas indicate regions where <1 second fireballs have a higher concentration of data points compared to the number of fireballs >1 second, and the red is the inverse.
Current usage metrics show cumulative count of Article Views (full-text article views including HTML views, PDF and ePub downloads, according to the available data) and Abstracts Views on Vision4Press platform.
Data correspond to usage on the plateform after 2015. The current usage metrics is available 48-96 hours after online publication and is updated daily on week days.
Initial download of the metrics may take a while.