Fig. 10
Download original image
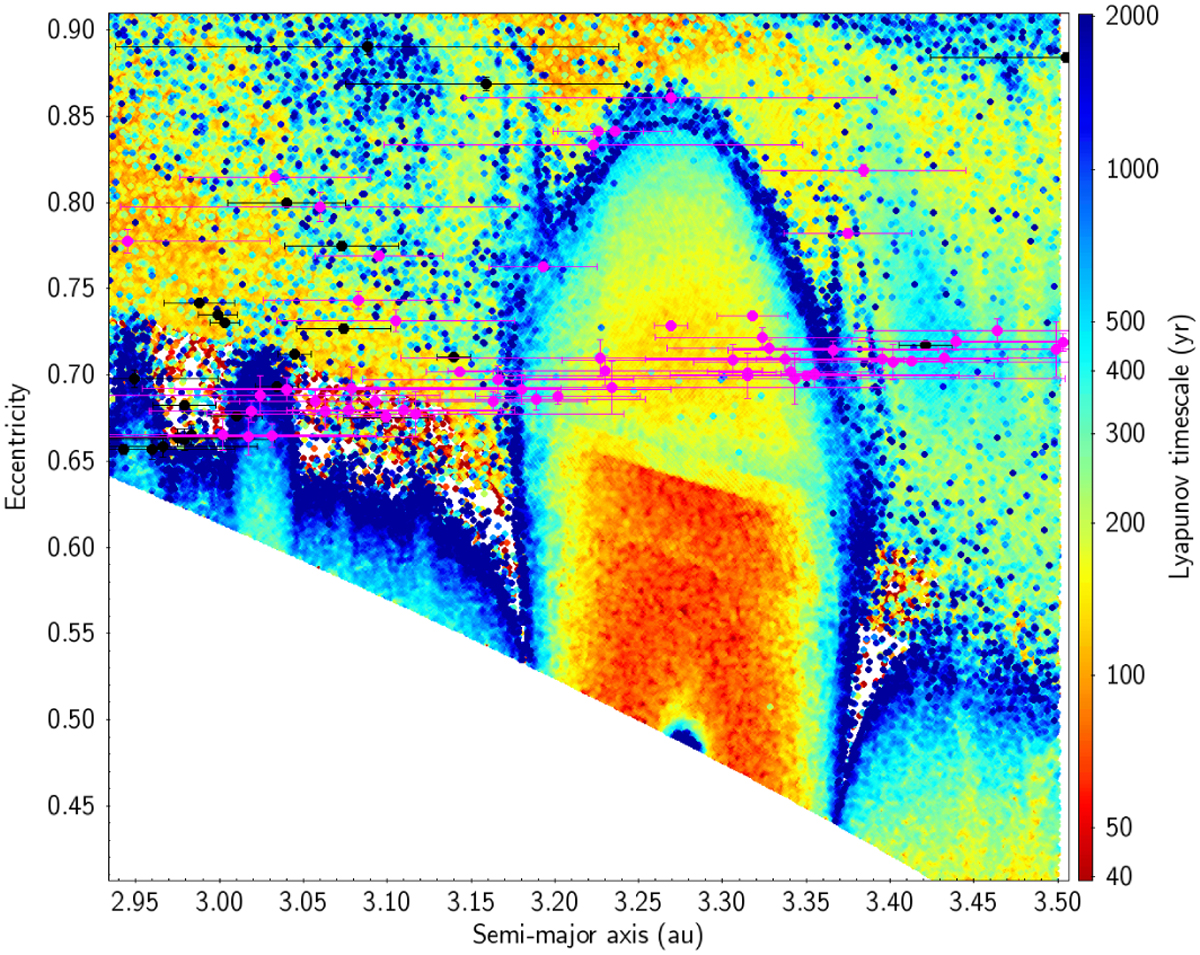
Chaos heat map in a-e space using Lyapunov lifetimes (the inverse of the Lyapunov exponent) calculated from 435 000 randomized orbits. The coloration indicated the mean Lyapunov lifetime at that point in space, while the individual black points are fireball data points from the EFN network, and the pink points are the fireballs that lie within 3σ of the 2:1 MMR. The 2:1 MMR is clearly visible in the plot centered at around 3.27 au.
Current usage metrics show cumulative count of Article Views (full-text article views including HTML views, PDF and ePub downloads, according to the available data) and Abstracts Views on Vision4Press platform.
Data correspond to usage on the plateform after 2015. The current usage metrics is available 48-96 hours after online publication and is updated daily on week days.
Initial download of the metrics may take a while.