Open Access
Fig. 6.
Download original image
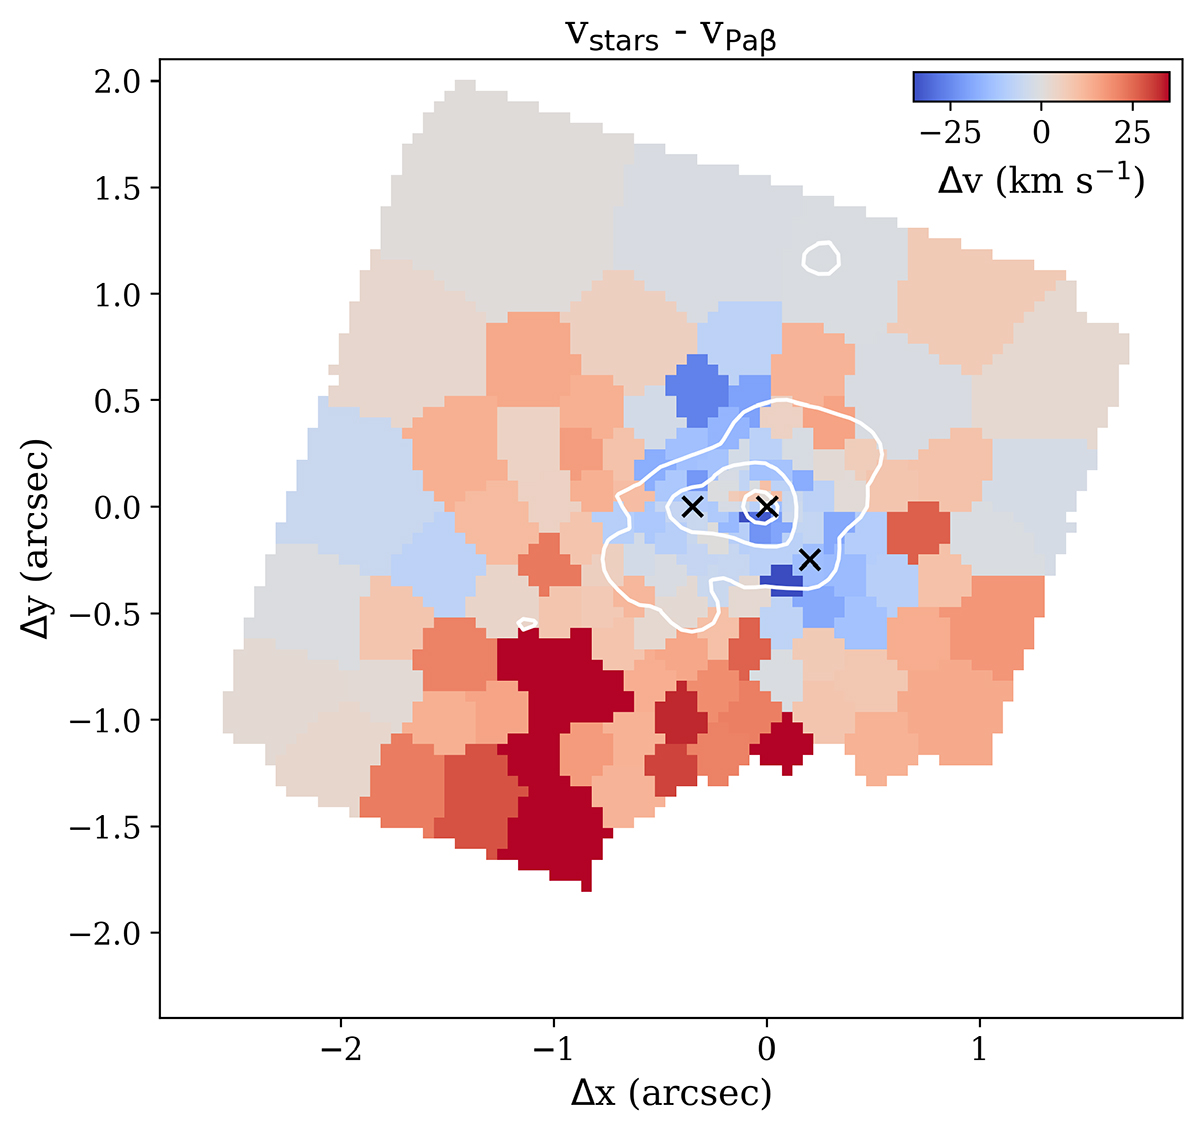
Difference between stellar velocity and Paβ velocity from the binned cubes. The region where gas velocities are lower than the stellar velocities (blue colours) coincide with regions of high gas dispersions (Fig. 5). Only bins with velocity uncertainties < 10 km s−1 are shown.
Current usage metrics show cumulative count of Article Views (full-text article views including HTML views, PDF and ePub downloads, according to the available data) and Abstracts Views on Vision4Press platform.
Data correspond to usage on the plateform after 2015. The current usage metrics is available 48-96 hours after online publication and is updated daily on week days.
Initial download of the metrics may take a while.