Open Access
Fig. 4.
Download original image
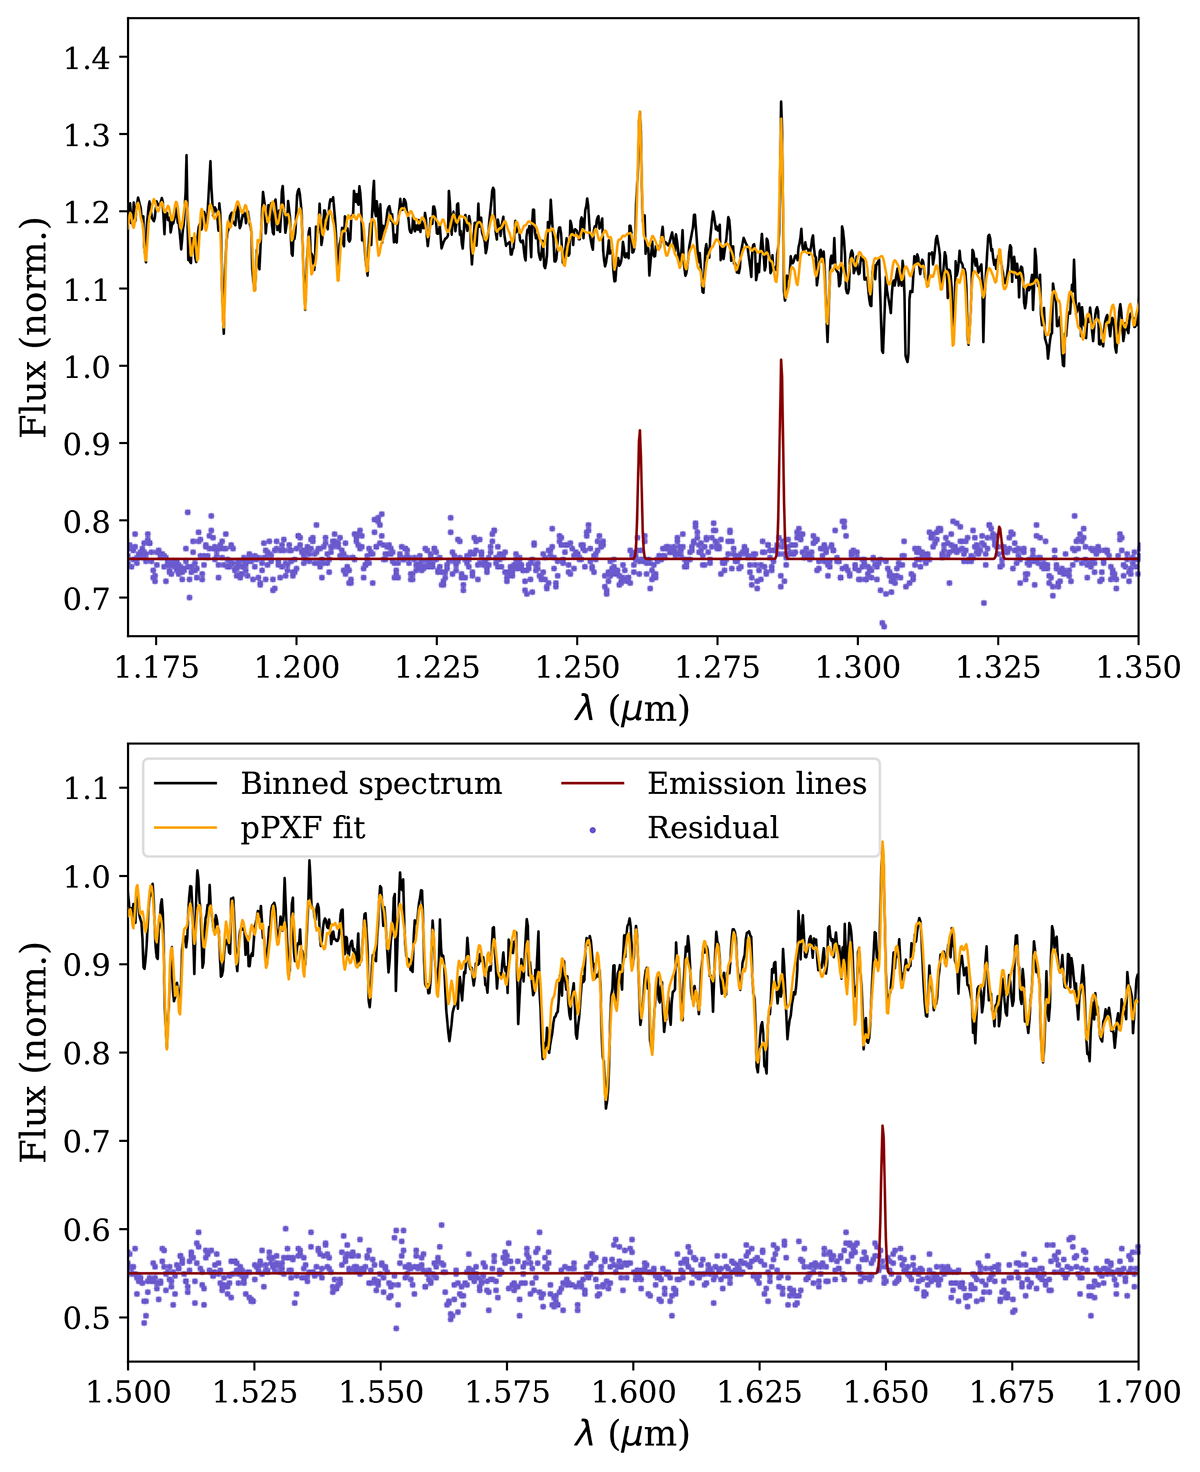
Example of the pPXF fit to the spectrum of cluster 1 from the G140H grating. The original spectrum is shown in black. The PPXF fit using the XSL SSP models is shown in orange. This includes emission lines as shown in dark red. The residual is shown in purple, shifted to an arbitrary value for visualisation.
Current usage metrics show cumulative count of Article Views (full-text article views including HTML views, PDF and ePub downloads, according to the available data) and Abstracts Views on Vision4Press platform.
Data correspond to usage on the plateform after 2015. The current usage metrics is available 48-96 hours after online publication and is updated daily on week days.
Initial download of the metrics may take a while.