Fig. 3.
Download original image
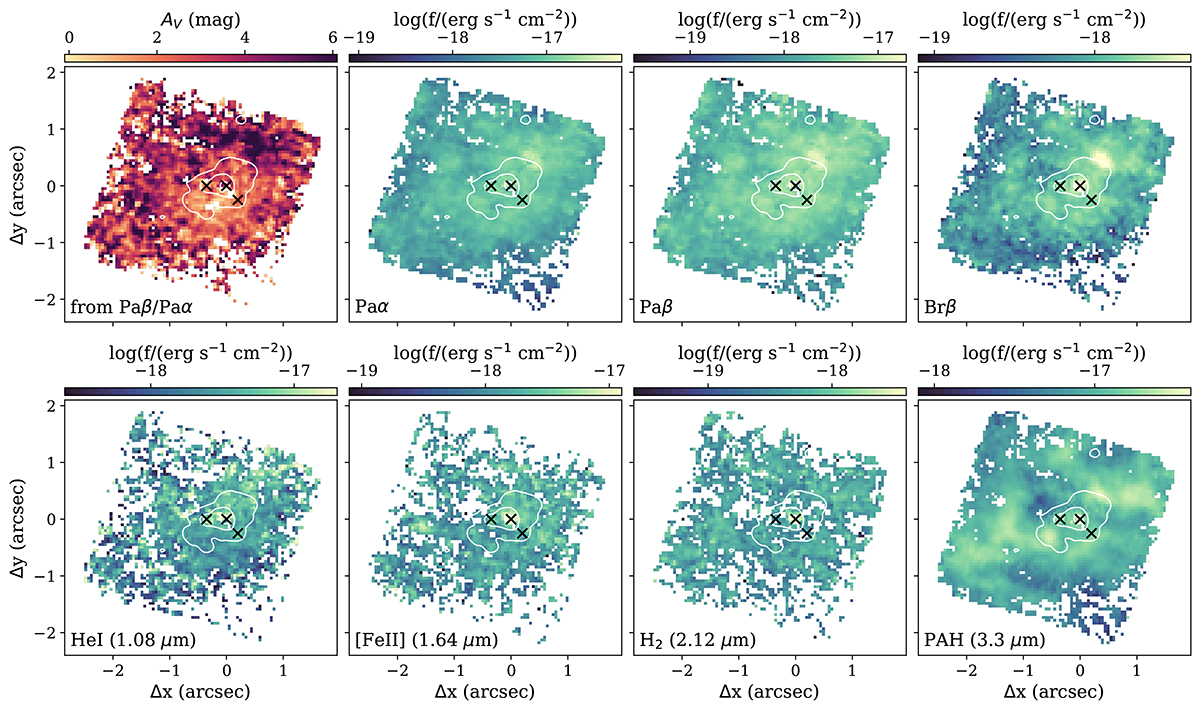
Maps of extinction and emission line fluxes. The top left panel shows the extinction map derived from the Paschen decrement. The remaining panels show flux maps for the Paα, Paβ, Brβ, HeI (1.08 μm), [FeII] (1.64 μm), H2 (2.21 μm), and PAH (3.3 μm) lines. These were corrected for extinction using the extinction map. Black contours show flux values from the F360M image for visualisation. Crosses mark the positions of the three clusters. Only spaxels with a S/N > 3 in the respective line are shown.
Current usage metrics show cumulative count of Article Views (full-text article views including HTML views, PDF and ePub downloads, according to the available data) and Abstracts Views on Vision4Press platform.
Data correspond to usage on the plateform after 2015. The current usage metrics is available 48-96 hours after online publication and is updated daily on week days.
Initial download of the metrics may take a while.