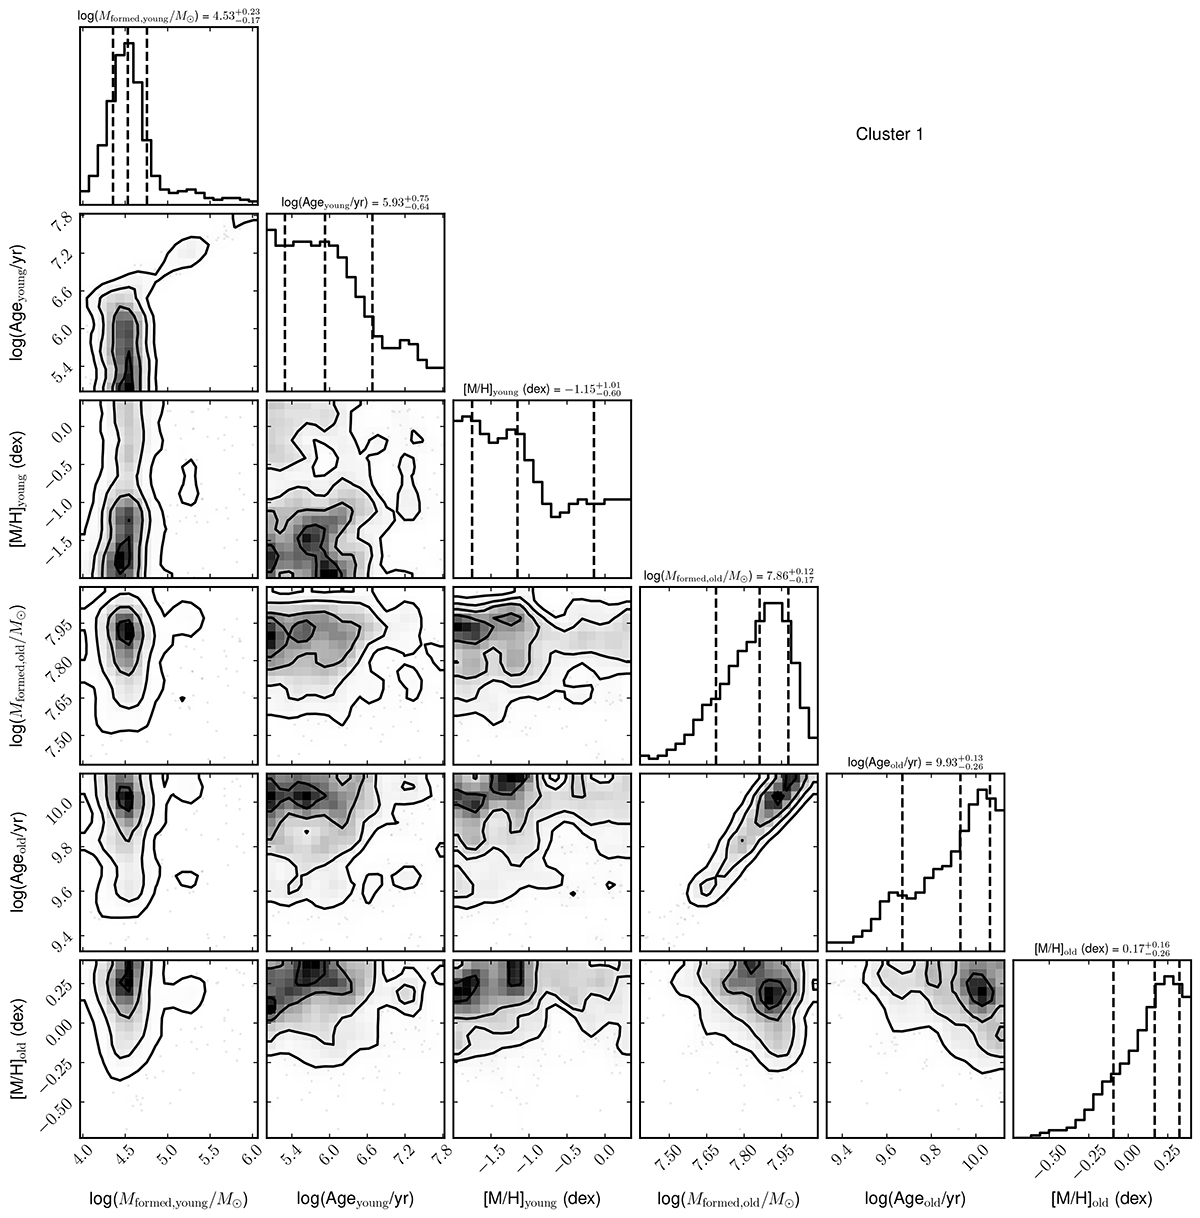
Fig. B.1.
Download original image
Corner plot showing the posterior distributions of the BAGPIPES fit to the fluxes of cluster 1. The dashed lines show the 16th, 50th, and 84th percentiles of the distributions. As described in Sect. 5, this cluster requires two populations to explain both the UV flux and the optical and NIR slopes. Only free parameters are shown here.
Current usage metrics show cumulative count of Article Views (full-text article views including HTML views, PDF and ePub downloads, according to the available data) and Abstracts Views on Vision4Press platform.
Data correspond to usage on the plateform after 2015. The current usage metrics is available 48-96 hours after online publication and is updated daily on week days.
Initial download of the metrics may take a while.