Open Access
Fig. 8
Download original image
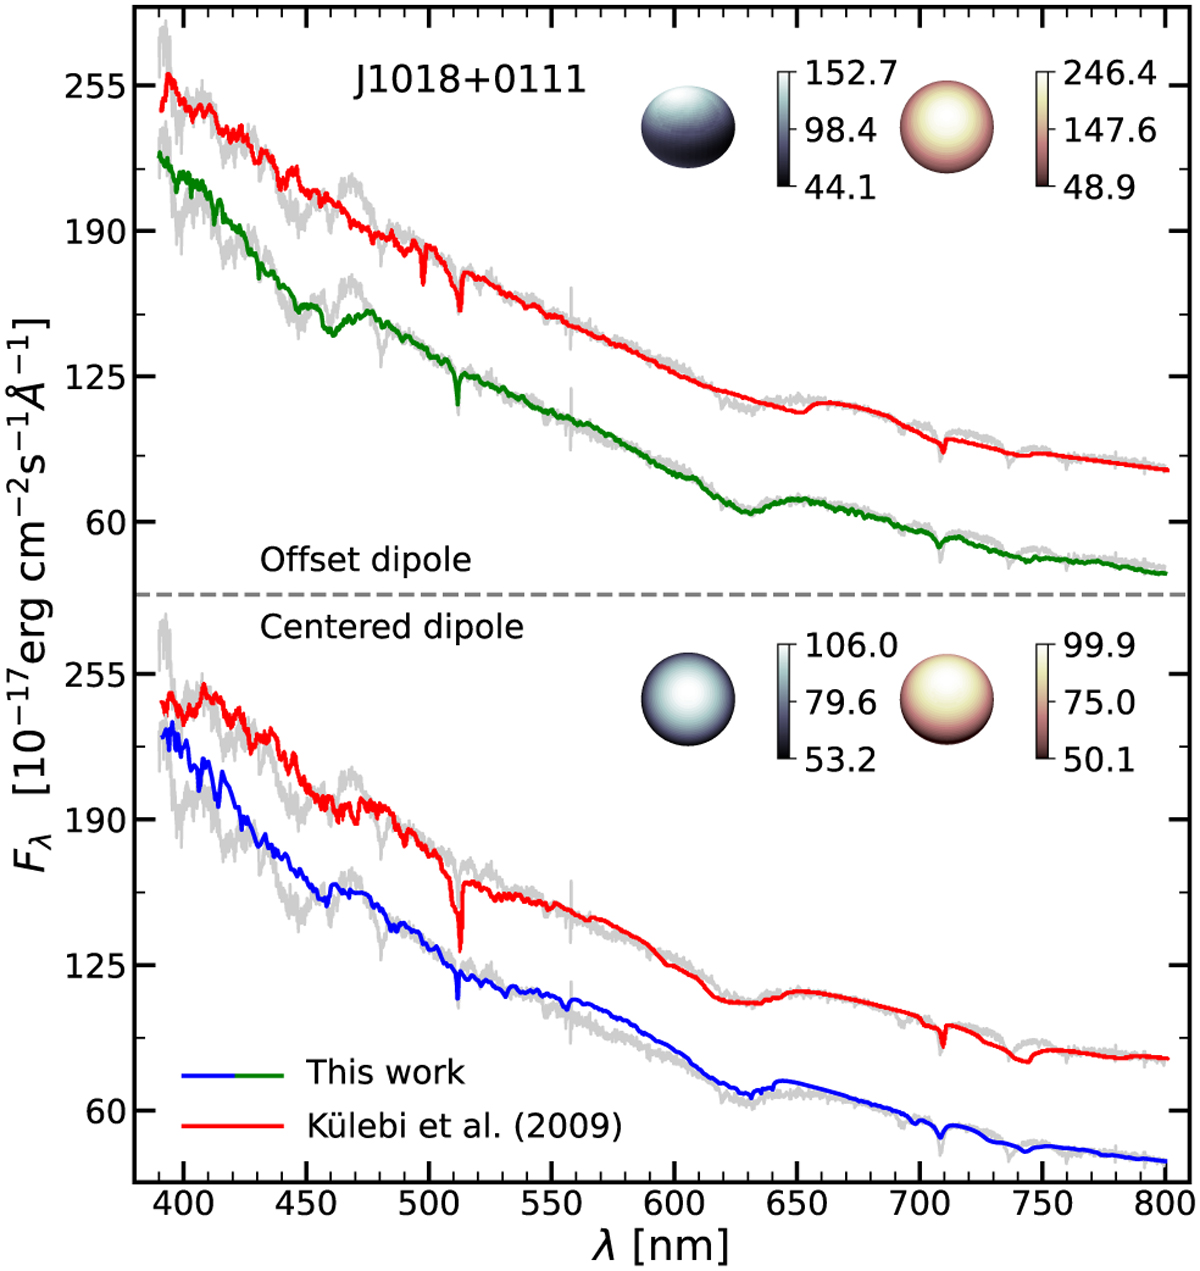
Observed spectrum of J1018+0111 (gray lines) compared to best fits obtained in this work (green and blue lines) and by Külebi et al. (2009) (red lines), for both centered and offset dipoles (their intensity maps are shown in the inserted plots).
Current usage metrics show cumulative count of Article Views (full-text article views including HTML views, PDF and ePub downloads, according to the available data) and Abstracts Views on Vision4Press platform.
Data correspond to usage on the plateform after 2015. The current usage metrics is available 48-96 hours after online publication and is updated daily on week days.
Initial download of the metrics may take a while.