Fig. 7
Download original image
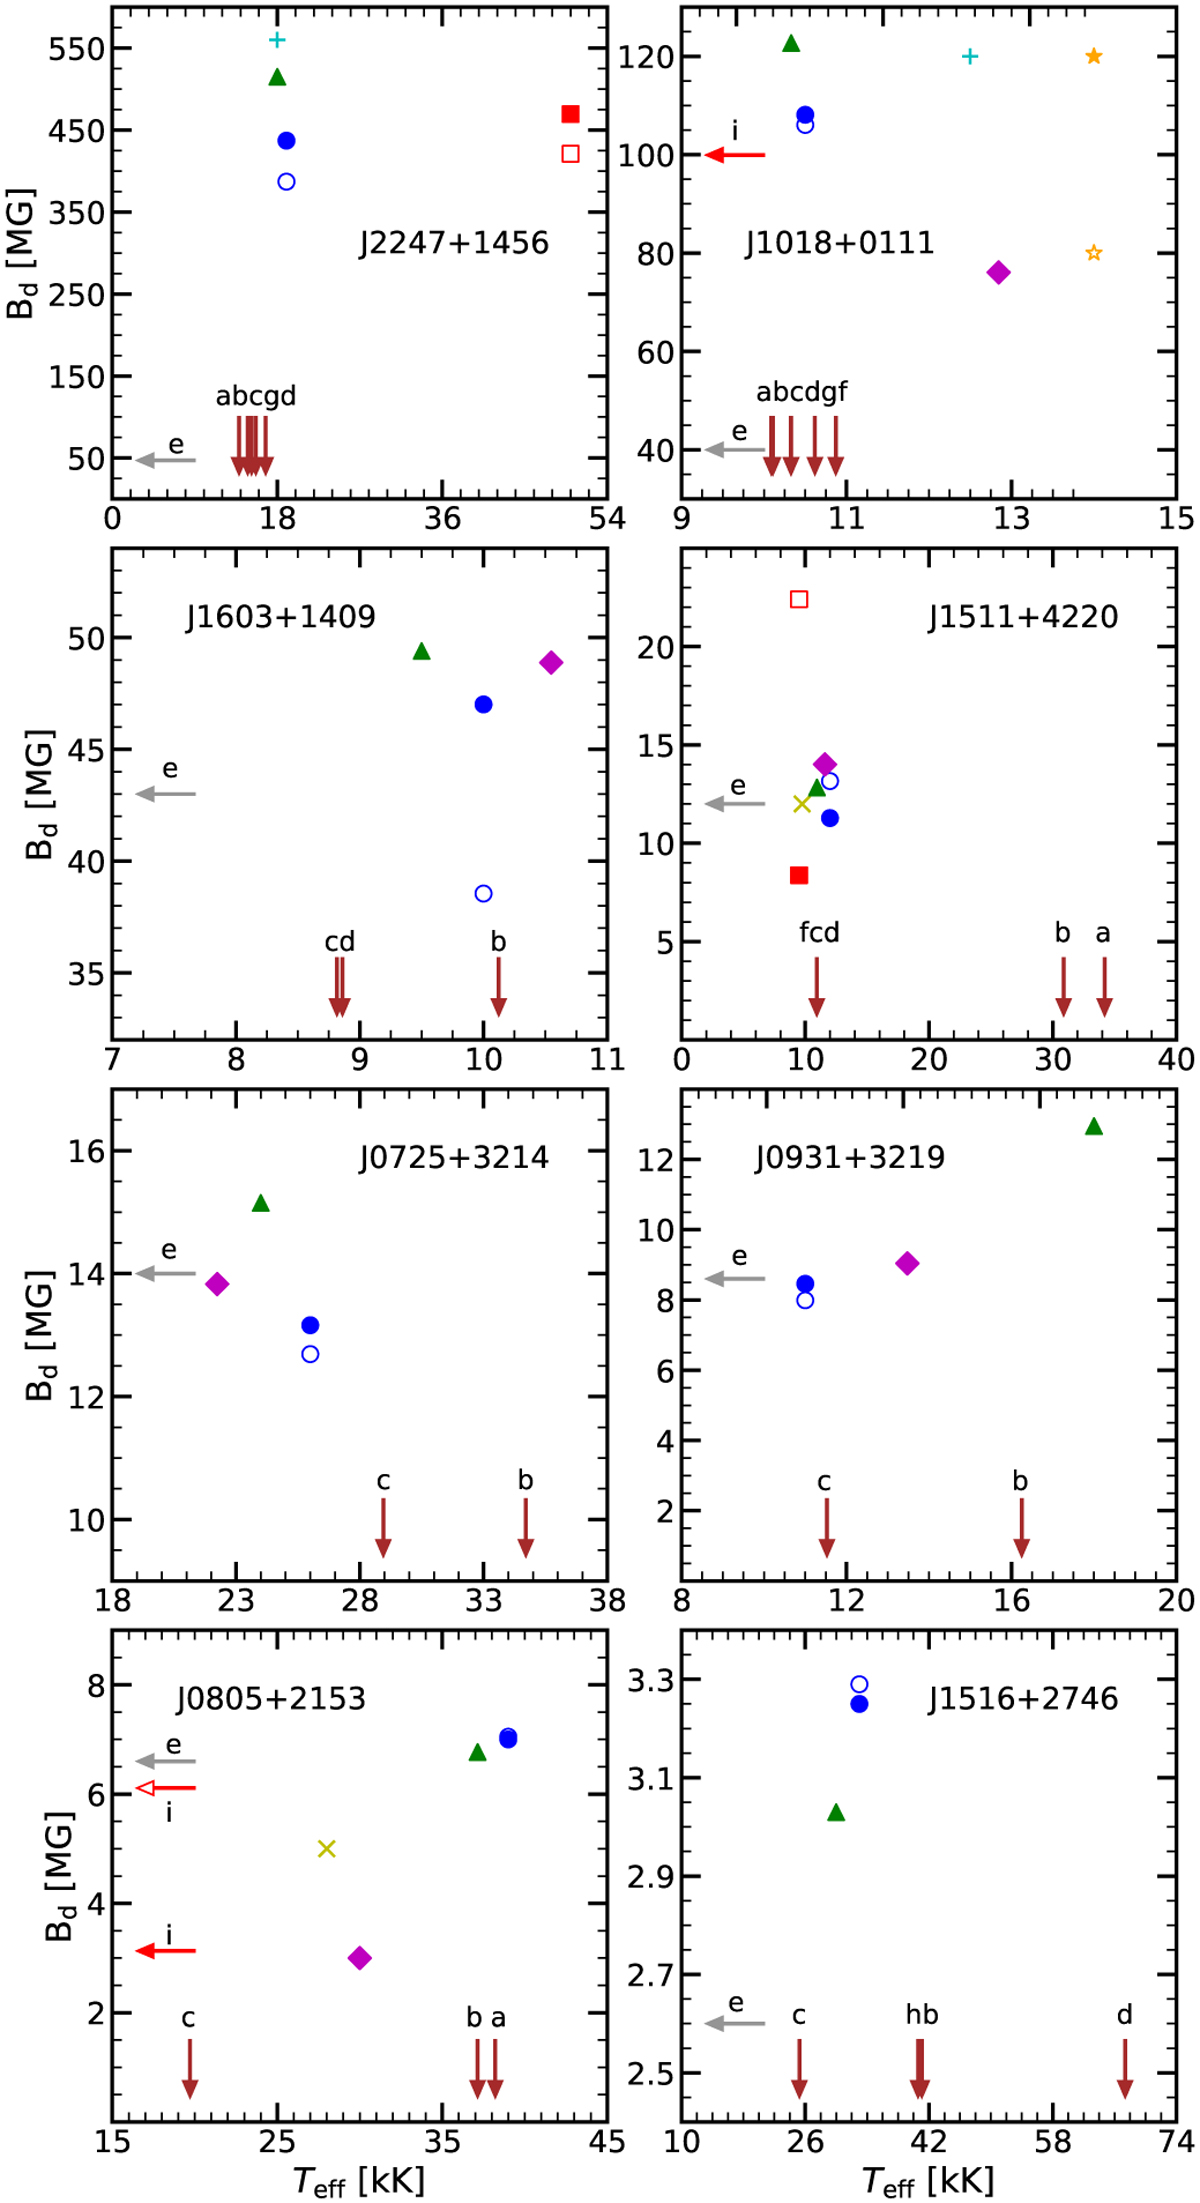
Location of a group of MWDs in B-Teff diagrams, as determined from spectrum fits (symbols) and spectroscopic analysis (arrows). Vertical (horizontal) arrows mark effective temperature (field strength) obtained from spectroscopic analysis. Open (filled) symbol for centered (off-center) dipole model. Notation: a (Eisenstein et al. 2006), b (Kleinman et al. 2013), c (Dufour et al. 2017), d (Gentile Fusillo et al. 2021), e (Kepler et al. 2013), f (Kilic et al. 2020), g (Leggett et al. 2018), h (Bédard et al. 2020), i/squares (Külebi et al. 2009), diamonds (Hardy et al. 2023), triangles (Amorim et al. 2023), x (Vanlandingham et al. 2005), crosses (Schmidt et al. 2003), stars (Wickramasinghe & Cropper 1988), circles (this work).
Current usage metrics show cumulative count of Article Views (full-text article views including HTML views, PDF and ePub downloads, according to the available data) and Abstracts Views on Vision4Press platform.
Data correspond to usage on the plateform after 2015. The current usage metrics is available 48-96 hours after online publication and is updated daily on week days.
Initial download of the metrics may take a while.