Fig. 3
Download original image
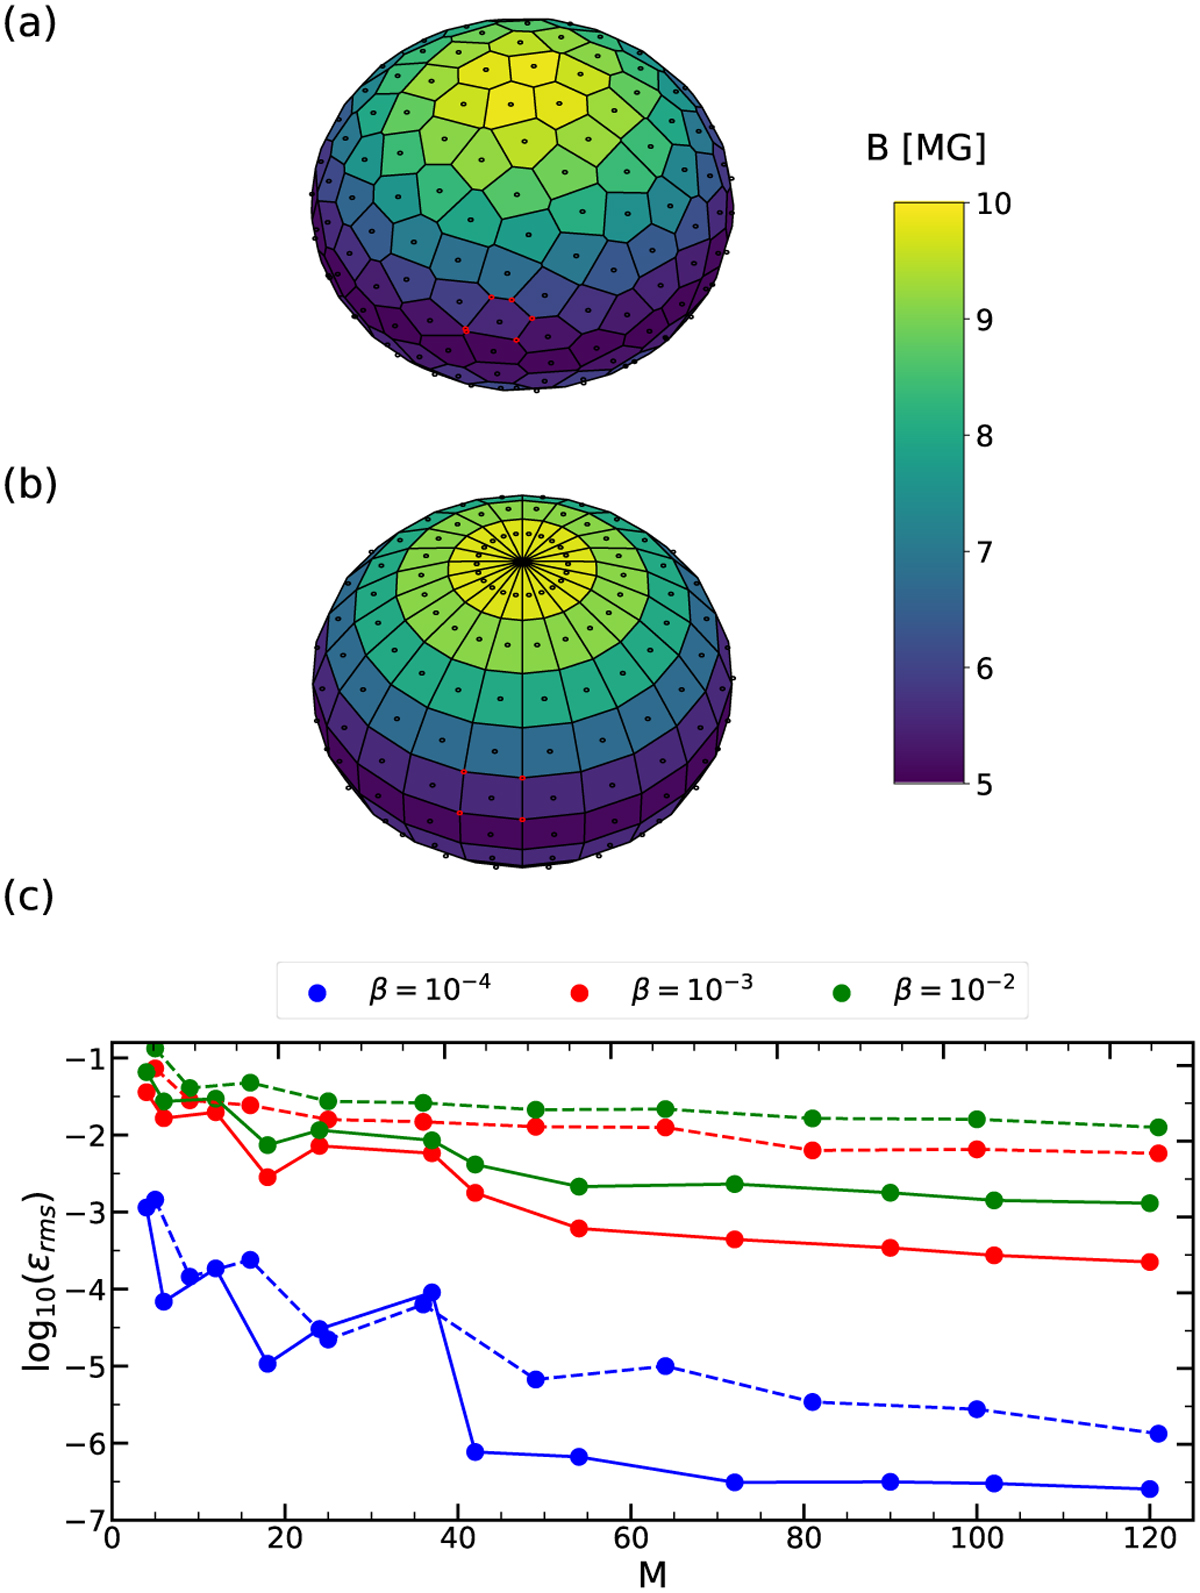
Segmentations of stellar surface and their performances in energy-flux integrations for a centered dipole (Bd = 10 MG, i = 45°). The magnetic-field strength in each cell is averaged using its values on the center (black circle) and vertices (red circles). Upper panel: segmentation based on spherical t-design (t = 19) and its associated Voronoi tessellation. Middle panel: segmentation constructed with equal steps in latitude and longitude. Lower panel: variation of mean squared error of emerging flux as a function of the cell number for t-design (solid lines) and constant latitude and longitude step (dashed lines) integrations and different field strengths.
Current usage metrics show cumulative count of Article Views (full-text article views including HTML views, PDF and ePub downloads, according to the available data) and Abstracts Views on Vision4Press platform.
Data correspond to usage on the plateform after 2015. The current usage metrics is available 48-96 hours after online publication and is updated daily on week days.
Initial download of the metrics may take a while.