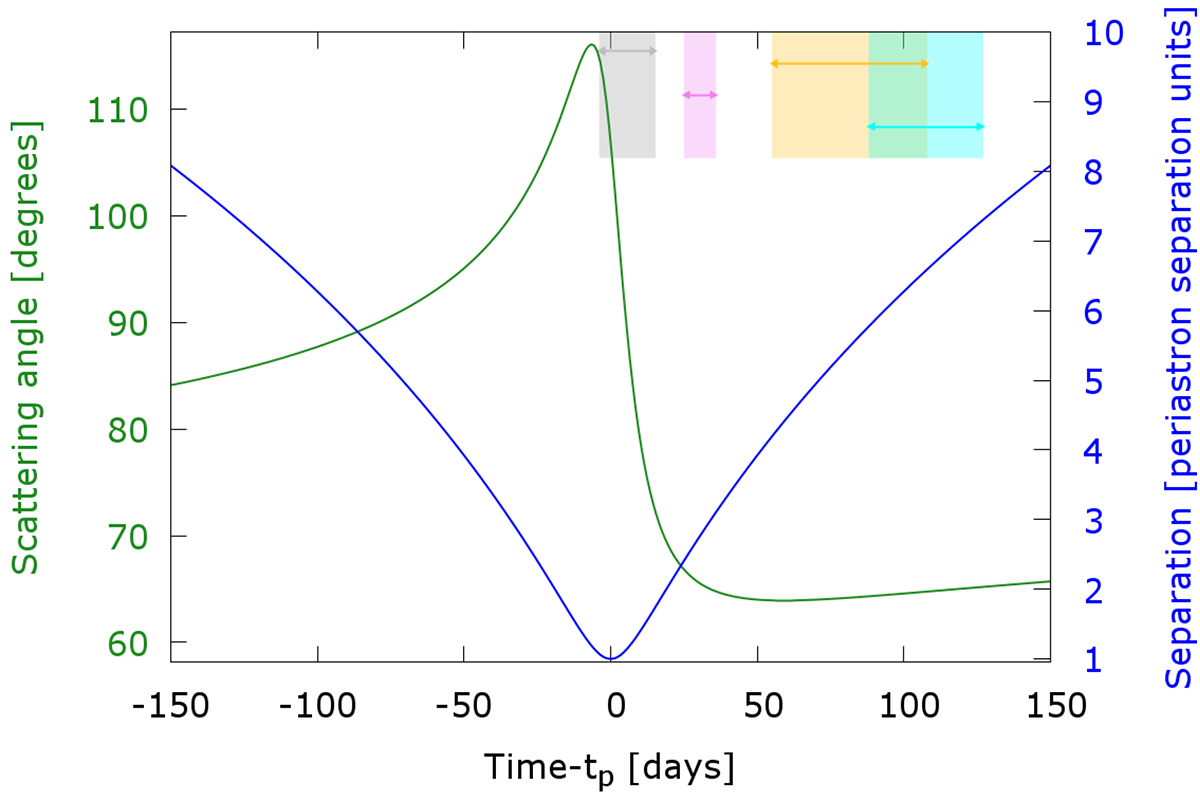
Fig. 7.
Download original image
Comparison of the scattering angle of IC processes to separation of the two objects comprising PSR B1259–63/LS 2883. Left axis, green curve: The angle between the line-of-sight and the direction from the optical star at the pulsar’s location, as a function of time to periastron passage. If the production region is close to the pulsar, this angle is equal to the scattering angle for IC processes. Right axis, blue curve: The ratio of the separation distance, R, to the periastron separation. The shaded regions in this plot represent the periods of the sub spectra and are defined as in Fig. 4 (see Table 2 for the full details of these sub-periods).
Current usage metrics show cumulative count of Article Views (full-text article views including HTML views, PDF and ePub downloads, according to the available data) and Abstracts Views on Vision4Press platform.
Data correspond to usage on the plateform after 2015. The current usage metrics is available 48-96 hours after online publication and is updated daily on week days.
Initial download of the metrics may take a while.