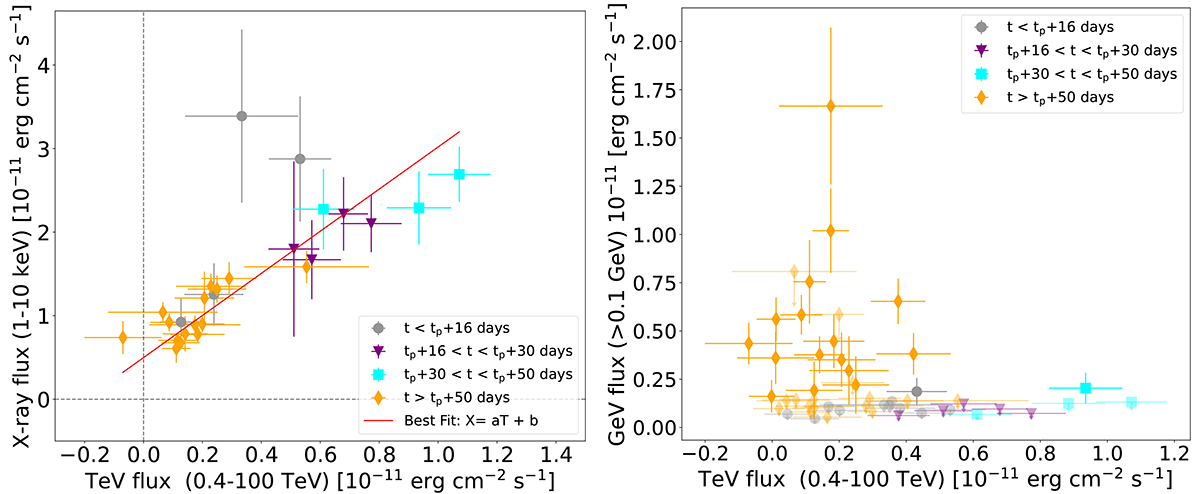
Fig. 6.
Download original image
Linear correlations between X-ray-TeV and GeV-TeV data sets. Left panel: linear correlation (FX = aFTeV + b) between the flux of the TeV and X-ray datasets, where exclusively integrated energy flux points measured within a day of one another were utilised. Shown in red is the line of best-fit resulting from a linear fit with an offset. A large outlier can be seen at TeV flux ∼0.3 × 10⁻¹¹ erg cm−2 s−1; this outlier originates from rapid X-ray variability in the period from periastron up to ∼tp + 16 days. The dashed lines mark the zero points of each axis. As can be seen, there is a non-zero X-ray flux value at zero TeV flux in the fit. Right panel: correlation plot of the flux of the TeV and GeV datasets, where exclusively flux points measured within a day of one another were used. Note that transparent points correspond to upper limits taken from the Fermi-LAT daily light curve, where each upper limit has been assumed to have a flux of half the upper limit value and a flux error corresponding to a 95% c.i. on the Fermi upper limit. GeV flux points have been adapted from Chernyakova et al. (2021). In both figures the orbital phases from which correlation points are taken are denoted by their colour (see Fig. 5).
Current usage metrics show cumulative count of Article Views (full-text article views including HTML views, PDF and ePub downloads, according to the available data) and Abstracts Views on Vision4Press platform.
Data correspond to usage on the plateform after 2015. The current usage metrics is available 48-96 hours after online publication and is updated daily on week days.
Initial download of the metrics may take a while.