Fig. 5.
Download original image
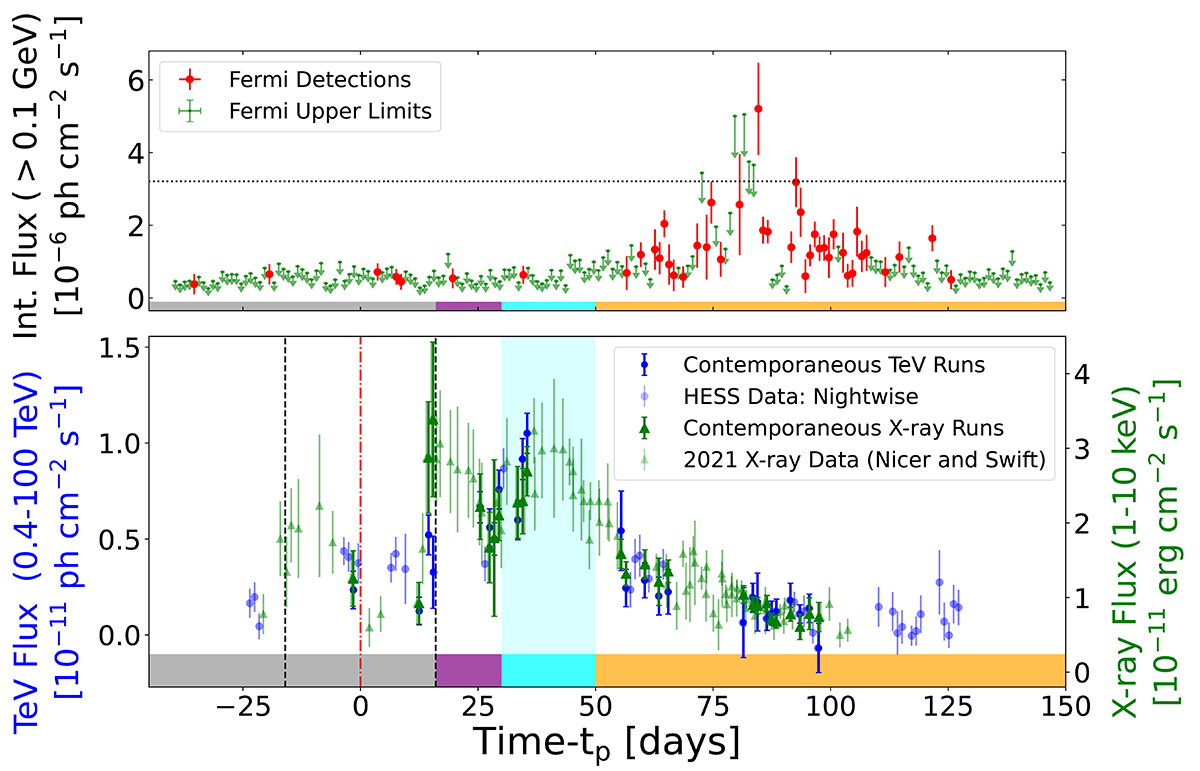
Comparison of the 2021 GeV light curve to the correlated X-ray and VHE light curves. Upper panel: the GeV light curve of PSR B1259–63/LS 2883’s 2021 periastron passage observed with Fermi-LAT (0.1 − 10 GeV). Figure adapted from Chernyakova et al. (2021). Data points represent daily binnings, with green points indicating 95% upper limits and red points denoting detections (TS > 4). The horizontal black dashed line marks the flux value corresponding to the spin-down luminosity of PSR B1259–63/LS 2883’s pulsar Lsd = 8.2 × 1035 erg s−1 (see Chernyakova et al. 2021). Lower panel: light curve of PSR B1259–63/LS 2883’s 2021 periastron passage displaying both VHE flux points from H.E.S.S. and X-ray data from the Swift and NICER observatories. Points with no transparency are points that were selected by the time correlation step and fell within a day of an alternate type of observation (see text for further details). Translucent points are data from each respective dataset that did not pass the time correlation step. The lines at ∼tp ± 16 days represent the assumed disc crossing times and the line at tp = 0 days marks the time of periastron. In both panels, coloured regions correspond to the orbital phases of correlation points in Fig. 6 that share the same colour. Here the grey region represents orbital phases before tp + 16 days, the purple region represents the time frame tp + 16 to tp + 30 days, the cyan region is the time frame tp + 30 to tp + 50 days (coincident with the third X-ray peak reported in 2021 X-ray data), and the orange region corresponds to any time after tp + 50 days.
Current usage metrics show cumulative count of Article Views (full-text article views including HTML views, PDF and ePub downloads, according to the available data) and Abstracts Views on Vision4Press platform.
Data correspond to usage on the plateform after 2015. The current usage metrics is available 48-96 hours after online publication and is updated daily on week days.
Initial download of the metrics may take a while.