Fig. 4.
Download original image
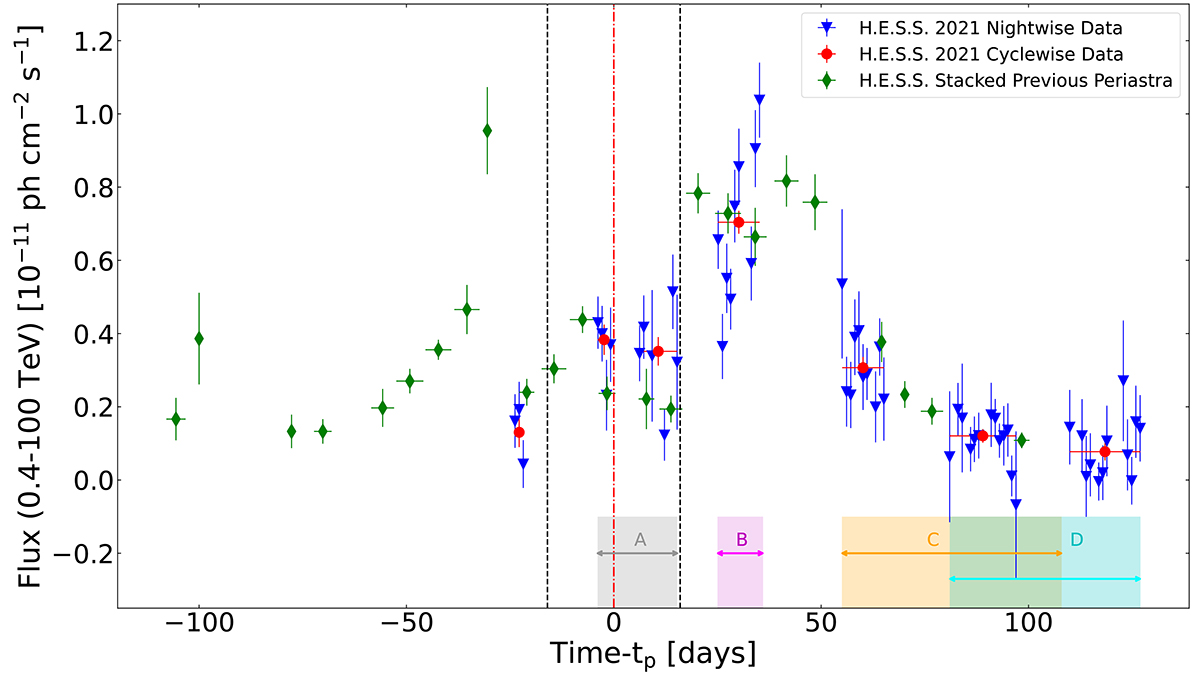
VHE light curve of PSR B1259–63/LS 2883’s 2021 periastron passage. VHE Data is shown in different binnings: night-wise binned fluxes (blue triangles), cycle-wise binned fluxes (red dots), and stacked data from H.E.S.S. observations of previous periastron passages (green diamonds). Horizontal error bars correspond to times of the earliest and latest runs that were merged to make the data point. Cycle-wise data contain the merged runs within one observational cycle (∼28 days). Stacked data points have a weekly binning and correspond to data from the 2004, 2007, 2011, 2014 and 2017 periastron passages; these points were taken from H.E.S.S. Collaboration (2020). The two dashed black lines at tp − 16 days and tp + 16 days correspond to the time at which the disc crossing is thought to occur, the dot-dashed red line at tp = 0 days represents the point of periastron in the system. Finally, the shaded areas with arrows are displayed as a visual representation of the time periods from which sub datasets were taken. These regions are also marked with the letters of the dataset they represent. The grey region represents the time period encompassed by dataset A, the magenta region corresponds to the time period of dataset B, and the yellow region and the cyan regions indicate the time periods of datasets C and D, respectively; see Table 2 for the full details of these sub-periods.
Current usage metrics show cumulative count of Article Views (full-text article views including HTML views, PDF and ePub downloads, according to the available data) and Abstracts Views on Vision4Press platform.
Data correspond to usage on the plateform after 2015. The current usage metrics is available 48-96 hours after online publication and is updated daily on week days.
Initial download of the metrics may take a while.