Open Access
Fig. B.1.
Download original image
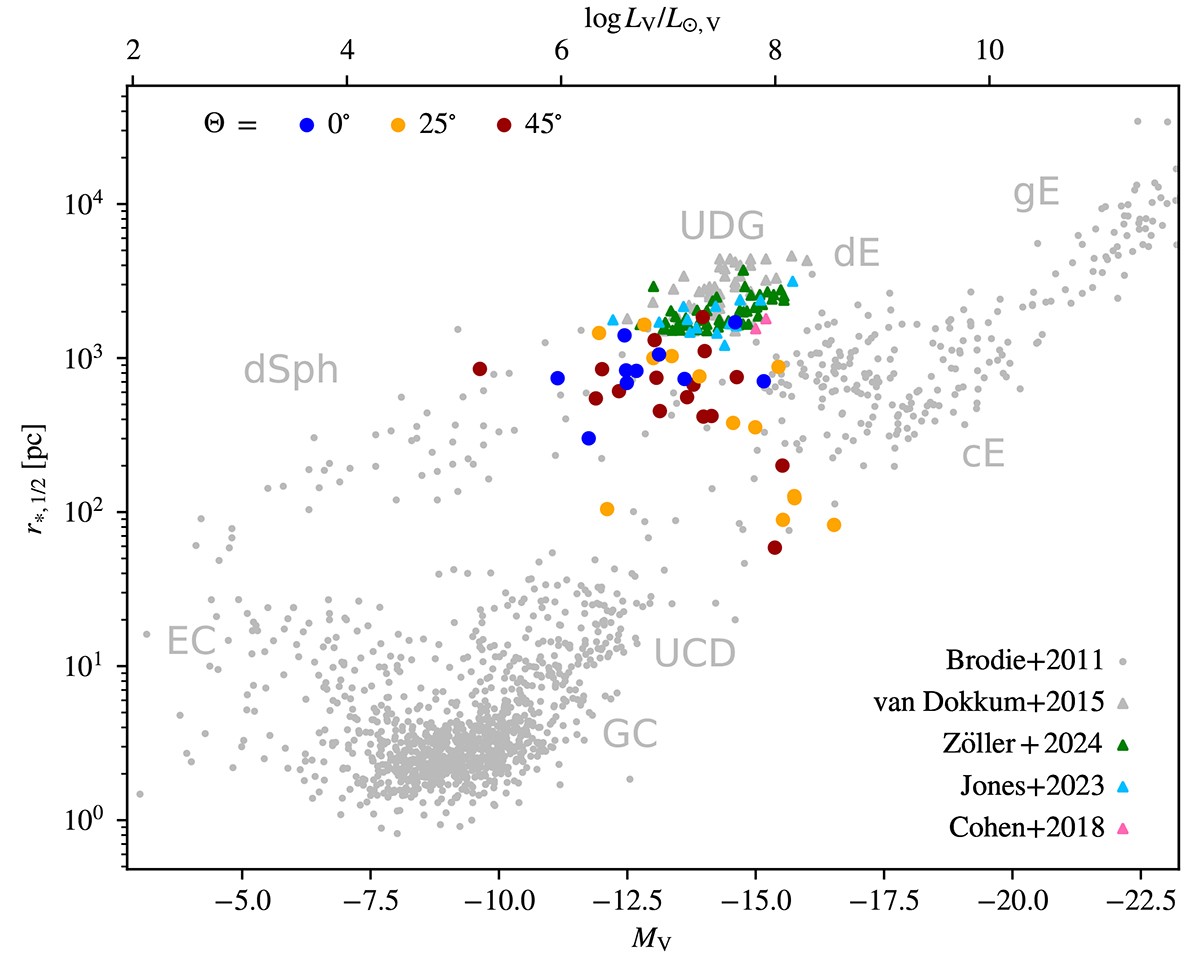
Simulated dwarf galaxy distribution at the same three moments in time as in Fig. 5, but with different color coding. Blue, orange, and red circles represent the C0, C25, and C45 orbit scenarios, respectively. For comparison, we include observational data by various authors listed in the legend.
Current usage metrics show cumulative count of Article Views (full-text article views including HTML views, PDF and ePub downloads, according to the available data) and Abstracts Views on Vision4Press platform.
Data correspond to usage on the plateform after 2015. The current usage metrics is available 48-96 hours after online publication and is updated daily on week days.
Initial download of the metrics may take a while.