Fig. 7
Download original image
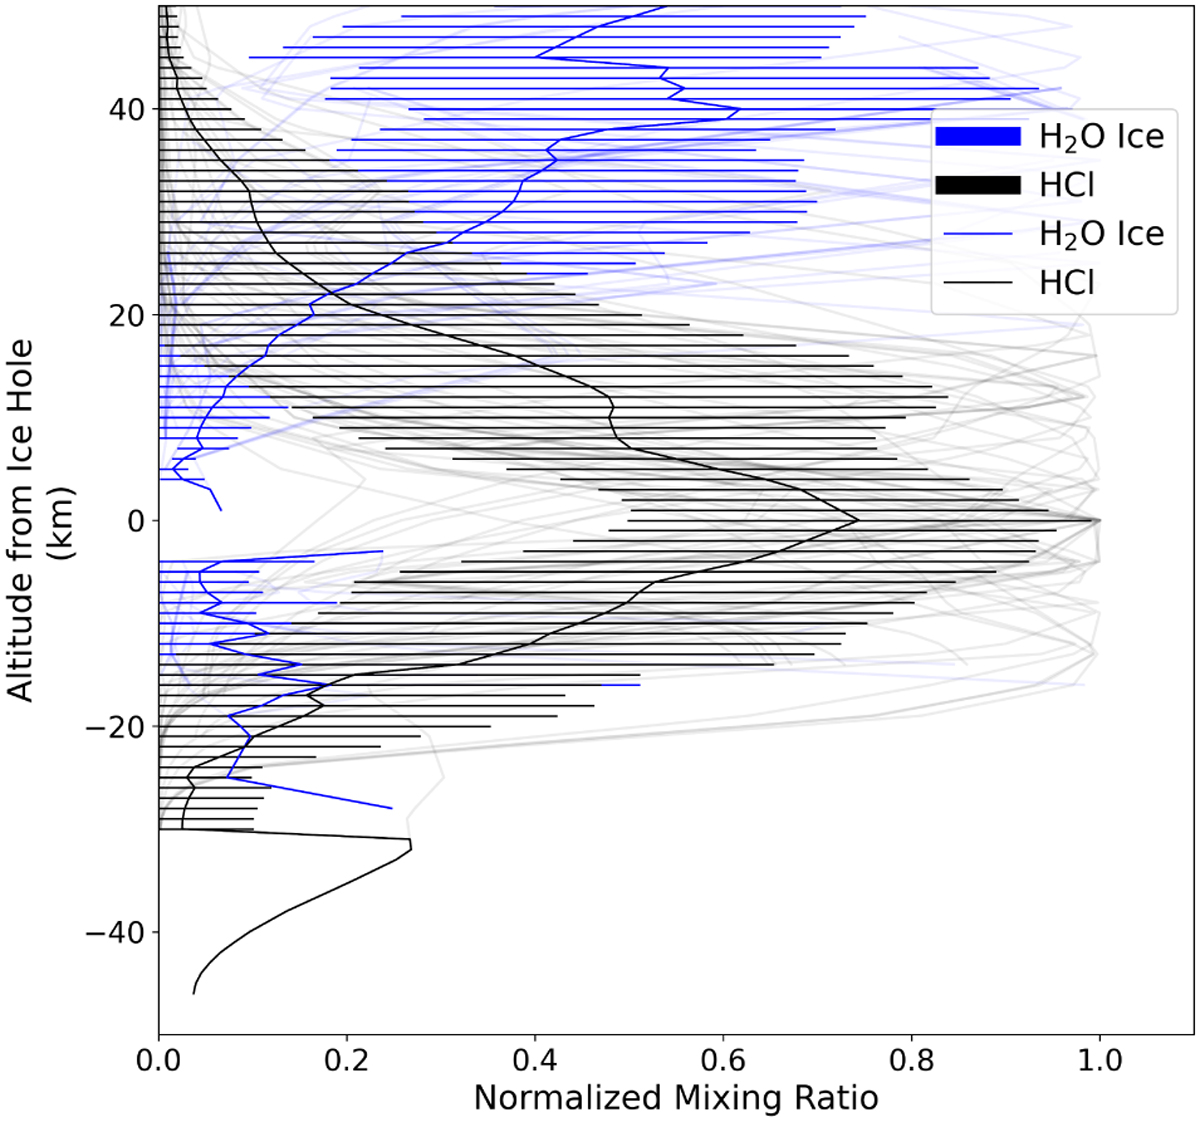
Normalised HCl profiles produced by our 1D photochemical model, driven by approximately colocated water ice profiles measured by ACS TIRVIM (presented in blue) and NOMAD/ACS NIR measured H2O profiles. Semi-transparent lines are individual profiles, and the opaque lines represent the mean and standard deviation of the plotted profiles. The profiles are centred on the altitude corresponding to the centre of the ice holes; the maximum HCl abundances calculated by the model closely coincide with the locations of the ice holes.
Current usage metrics show cumulative count of Article Views (full-text article views including HTML views, PDF and ePub downloads, according to the available data) and Abstracts Views on Vision4Press platform.
Data correspond to usage on the plateform after 2015. The current usage metrics is available 48-96 hours after online publication and is updated daily on week days.
Initial download of the metrics may take a while.