Fig. 5
Download original image
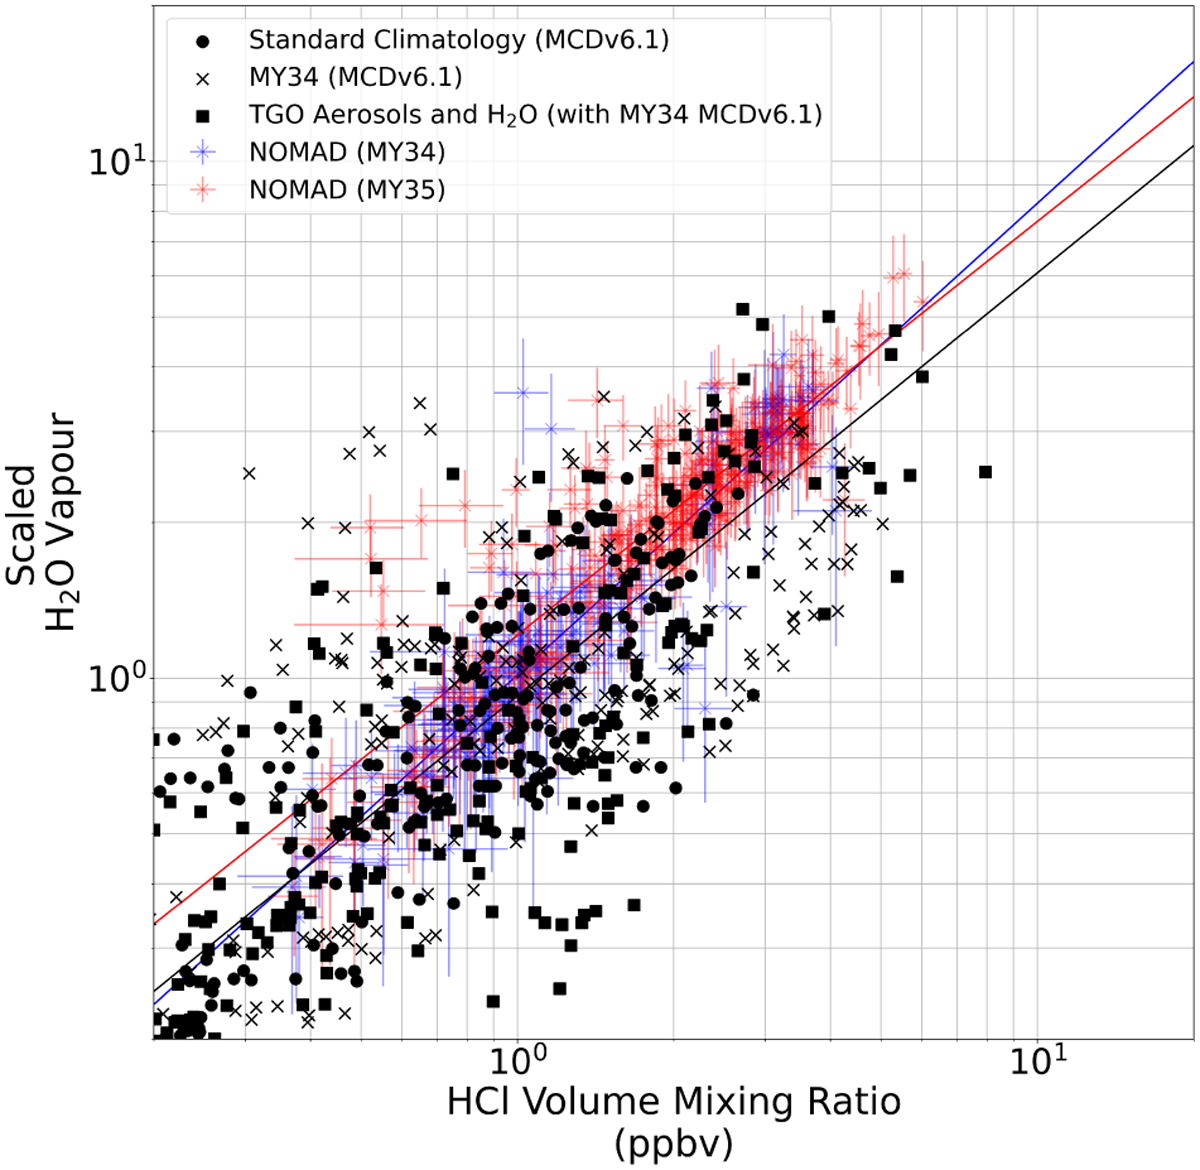
Comparisons of the normalised HCl and H2O VMR abundances observed by the NOMAD spectrometer in MY34–35 (Aoki et al. 2021) and the 77 1D photochemistry model runs with the standard climatolog-ical and MY34 datasets of the MCDv6.1, and MY34 with approximately colocated ACS TIRVIM aerosols and NOMAD/ACS NIR H2O profiles. Gradients (m) and correlation coefficients (R) for the lines of best fit are as follows. For all model runs, m = 0.82 and R = 0.854. For NOMAD MY34, m = 0.91 and R = 0.92. For NOMAD MY35, m = 0.80 and R = 0.90. This analysis follows Aoki et al. (2021).
Current usage metrics show cumulative count of Article Views (full-text article views including HTML views, PDF and ePub downloads, according to the available data) and Abstracts Views on Vision4Press platform.
Data correspond to usage on the plateform after 2015. The current usage metrics is available 48-96 hours after online publication and is updated daily on week days.
Initial download of the metrics may take a while.