Open Access
Fig. 2
Download original image
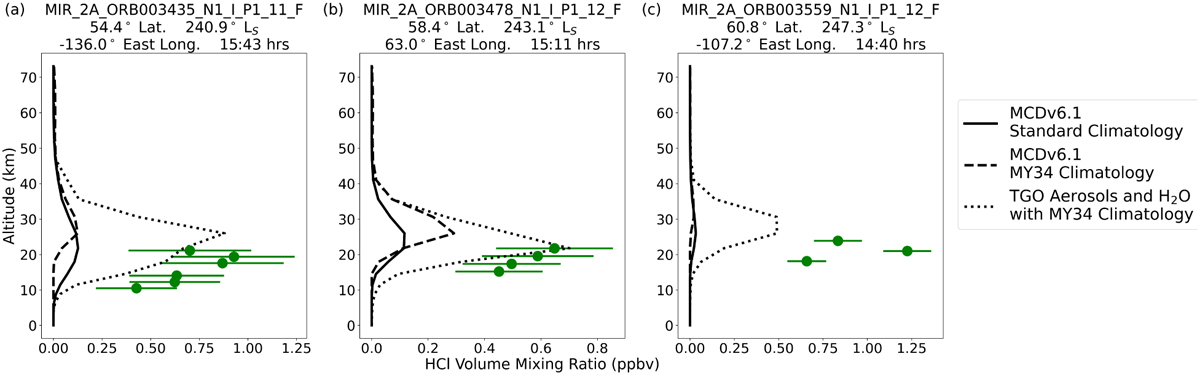
Three exemplar ACS/MIR and 1D model HCl VMR values (ppbv) as a function of altitude in MY34 for high northern latitudes, defined here as ranging from 45°N to 75°N. Dotted red lines indicate model results when driven by aerosols and H2O profiles from the ‘Standard Climatological’ MCDv6.l dataset.
Current usage metrics show cumulative count of Article Views (full-text article views including HTML views, PDF and ePub downloads, according to the available data) and Abstracts Views on Vision4Press platform.
Data correspond to usage on the plateform after 2015. The current usage metrics is available 48-96 hours after online publication and is updated daily on week days.
Initial download of the metrics may take a while.