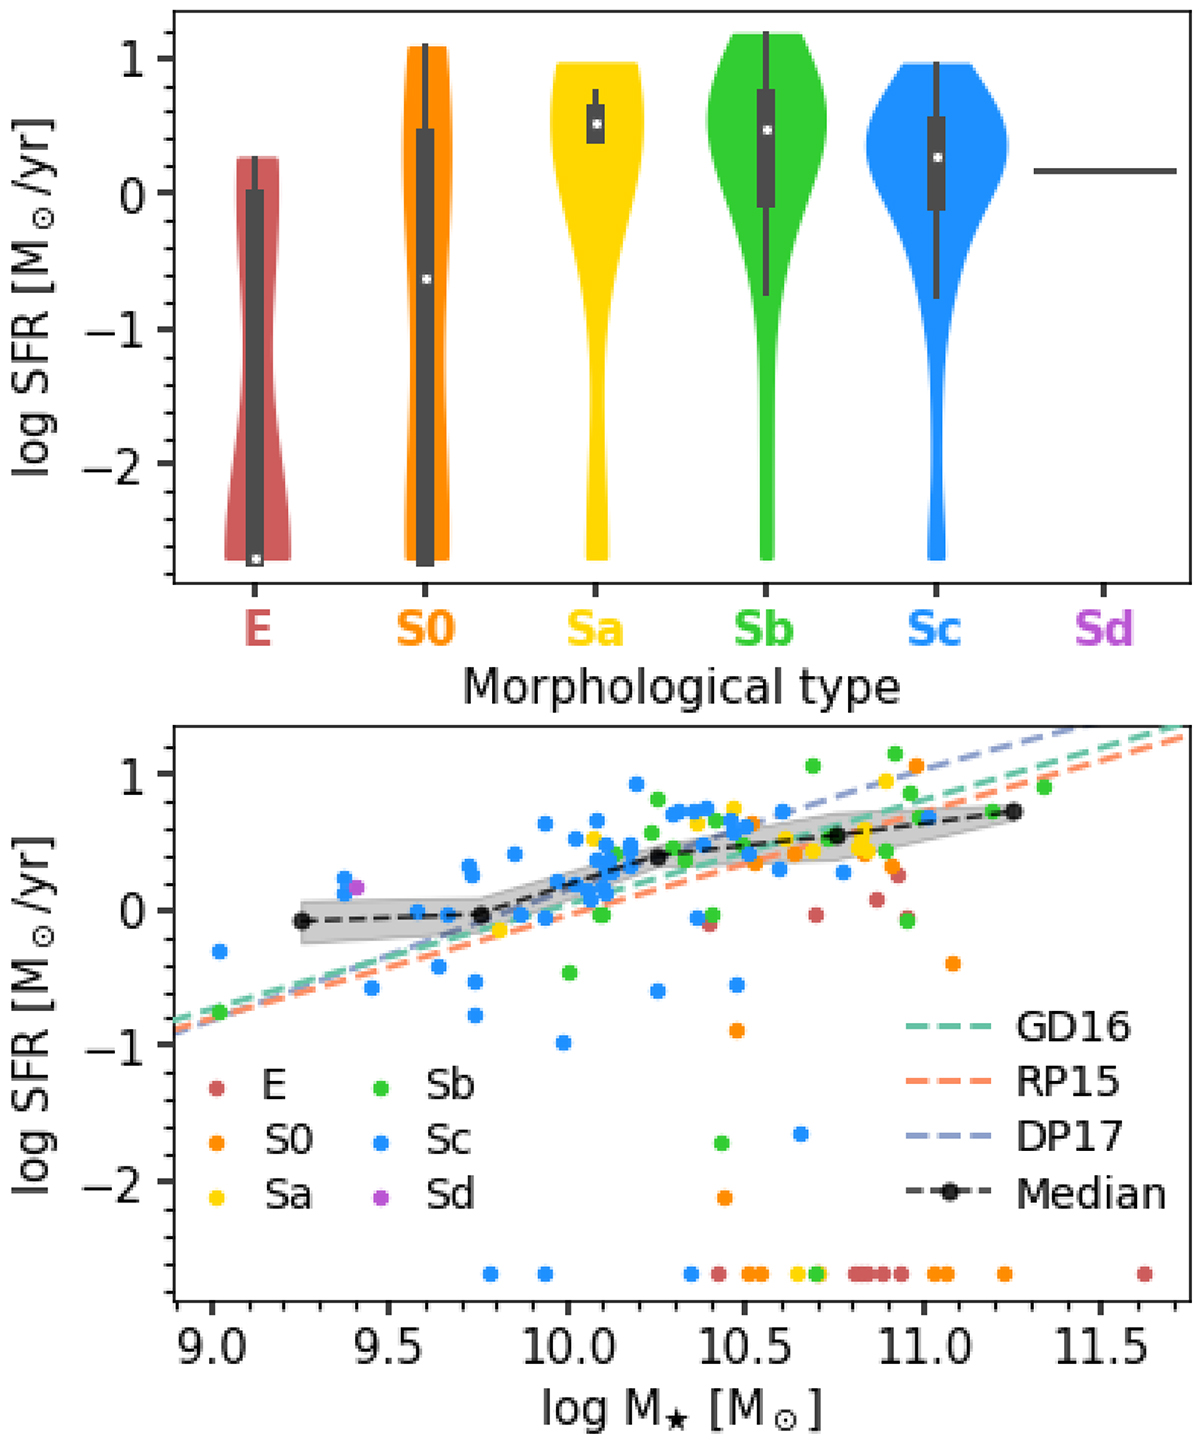
Fig. 9.
Download original image
Global SFR. The galaxies with SFR = 0 M⊙ yr−1 were given the value SFR = 10−2.67 M⊙ yr−1 (the value of the minimum minus the standard deviation) so that they could appear in the plots. Top: distribution of the SFR by morphological types (violin plot as in Fig. 4). Bottom: SFR versus stellar mass, coloured by morphological type. The dashed lines refer to the SFMS, parametrised as in González Delgado et al. (2016, in green), Renzini & Peng (2015, in orange) and Duarte Puertas et al. (2017, in blue). The black dots mark the median value of our data in bins of mass, taking into account only late spirals (Sb, Sc, Sd) that had originally SFR ≠ 0.
Current usage metrics show cumulative count of Article Views (full-text article views including HTML views, PDF and ePub downloads, according to the available data) and Abstracts Views on Vision4Press platform.
Data correspond to usage on the plateform after 2015. The current usage metrics is available 48-96 hours after online publication and is updated daily on week days.
Initial download of the metrics may take a while.