Fig. 6.
Download original image
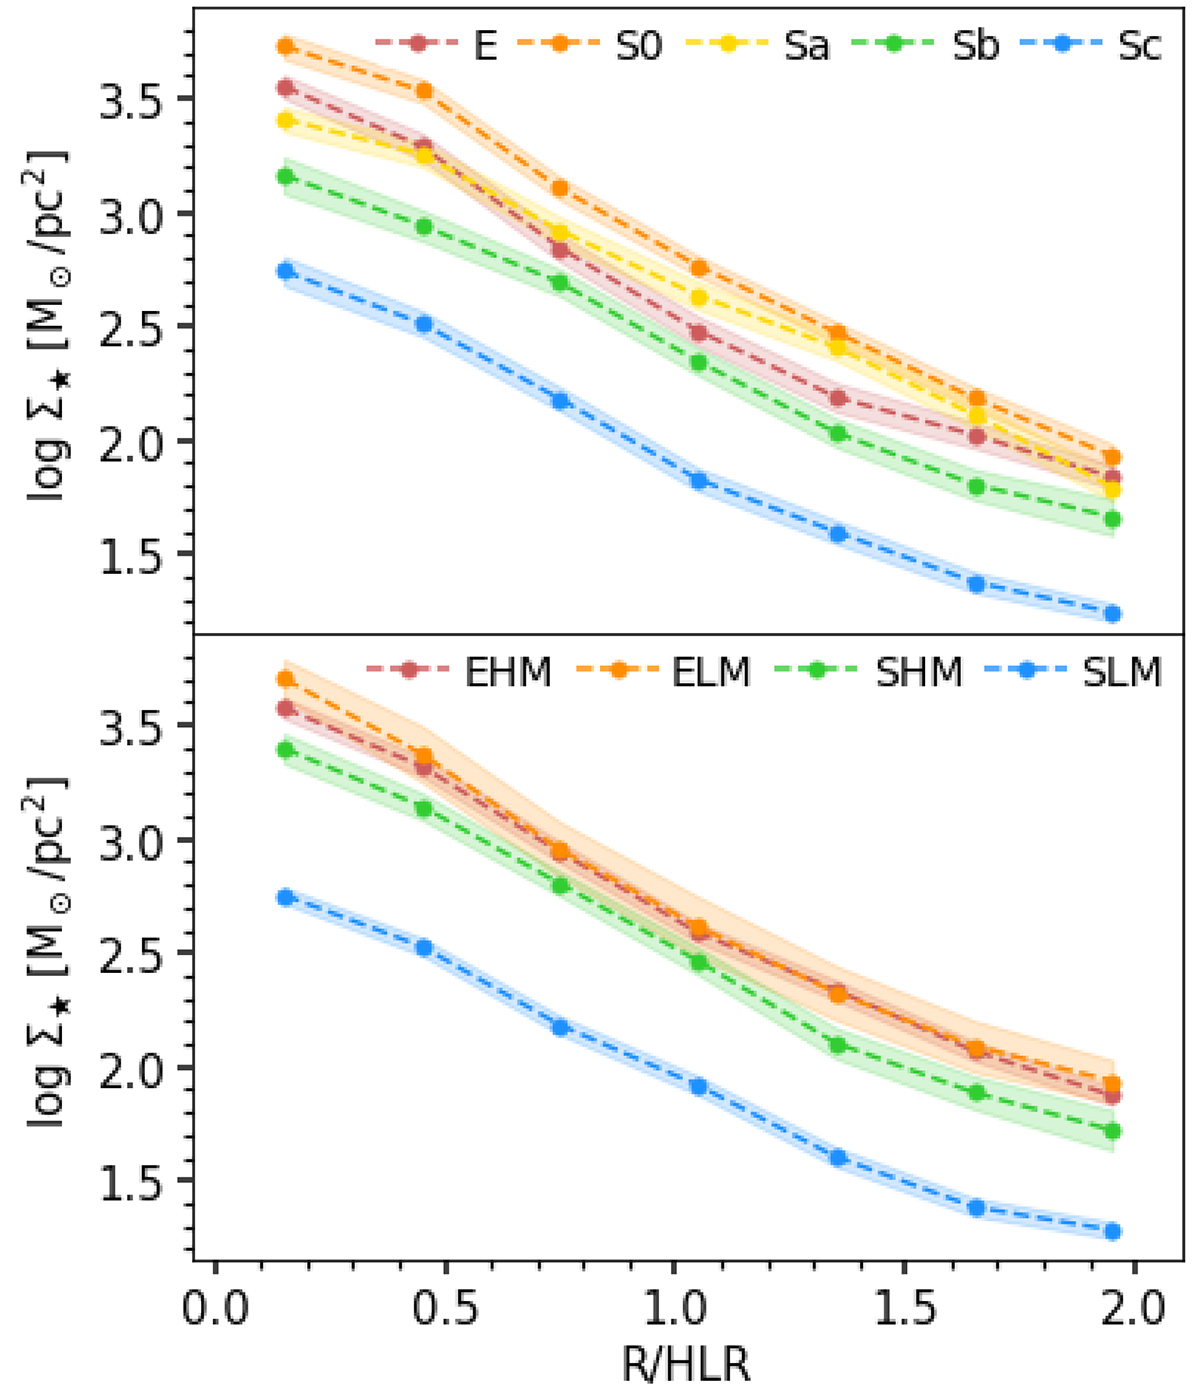
Stacked radial profiles of the stellar mass density. The shaded area marks the uncertainty, calculated as the standard deviation divided by the square root of the number of points in each R/HLR bin. Top: profiles by morphological types. We chose not to plot the profile from the Sd galaxy, as there is only one. Bottom: profiles by morphological and mass bins. We made 4 categories: early (E and S0) and spiral (Sb and Sc), and low (log M⋆/M⊙ ≤ 10.5) and high (log M⋆/M⊙ > 10.5) mass. The number of galaxies in each category is described in Table 2. The acronyms stand for early type high mass (EHM), early type low mass (ELM), spiral high mass (SHM) and spiral low mass (SLM).
Current usage metrics show cumulative count of Article Views (full-text article views including HTML views, PDF and ePub downloads, according to the available data) and Abstracts Views on Vision4Press platform.
Data correspond to usage on the plateform after 2015. The current usage metrics is available 48-96 hours after online publication and is updated daily on week days.
Initial download of the metrics may take a while.