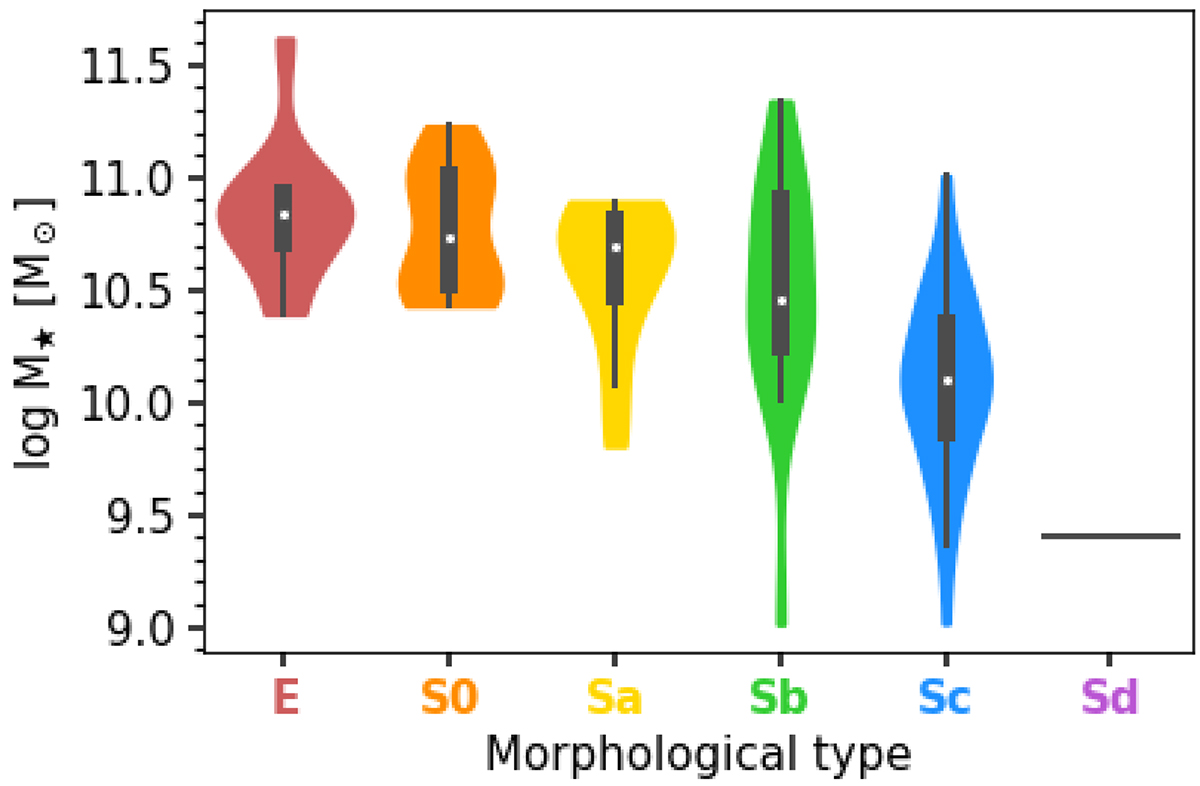
Fig. 4.
Download original image
Violin plots of the logarithm of the stellar mass for each morphological type. The coloured area determines the density distribution (Gaussian kernel), the white dot inside each of them marks the median value of each category, the thicker dark line ends in the first and third quartiles, and the thinner line reaches until the lower and upper adjacent values (points outside its range are considered outliers). The edges of the distributions are cut to define the minimum and maximum values. The Sd category only shows a line with the value for its single galaxy.
Current usage metrics show cumulative count of Article Views (full-text article views including HTML views, PDF and ePub downloads, according to the available data) and Abstracts Views on Vision4Press platform.
Data correspond to usage on the plateform after 2015. The current usage metrics is available 48-96 hours after online publication and is updated daily on week days.
Initial download of the metrics may take a while.