Open Access
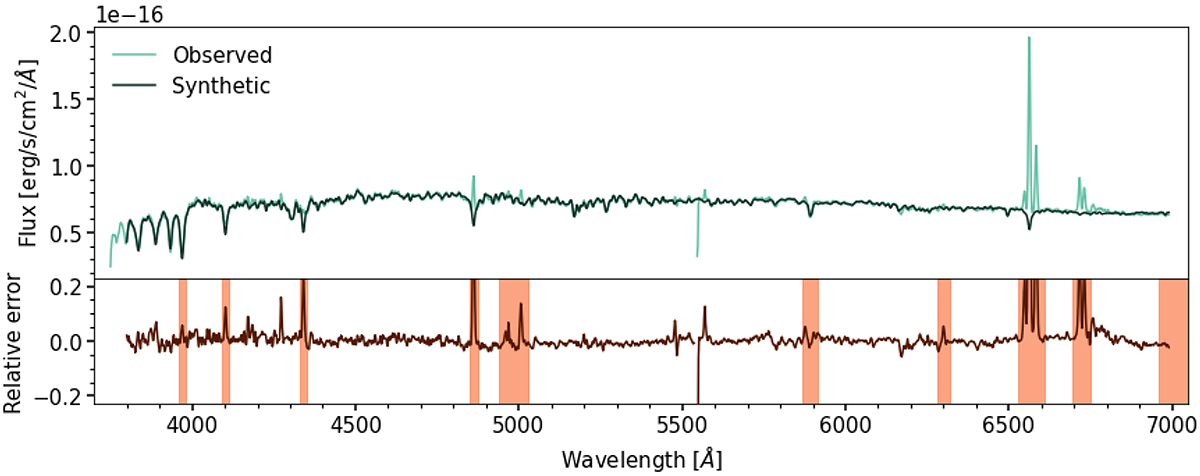
Fig. B.3.
Download original image
Example of a STARLIGHT spectral fit. Top panel: Observed and synthetic spectra of the central pixel of CAVITY54706. Bottom panel: Relative error of the fit: the observed flux minus the synthetic, divided by the observed flux in the normalisation wavelength (5635 Å). Wavelength sections in orange are masked during the fit.
Current usage metrics show cumulative count of Article Views (full-text article views including HTML views, PDF and ePub downloads, according to the available data) and Abstracts Views on Vision4Press platform.
Data correspond to usage on the plateform after 2015. The current usage metrics is available 48-96 hours after online publication and is updated daily on week days.
Initial download of the metrics may take a while.