Fig. 16.
Download original image
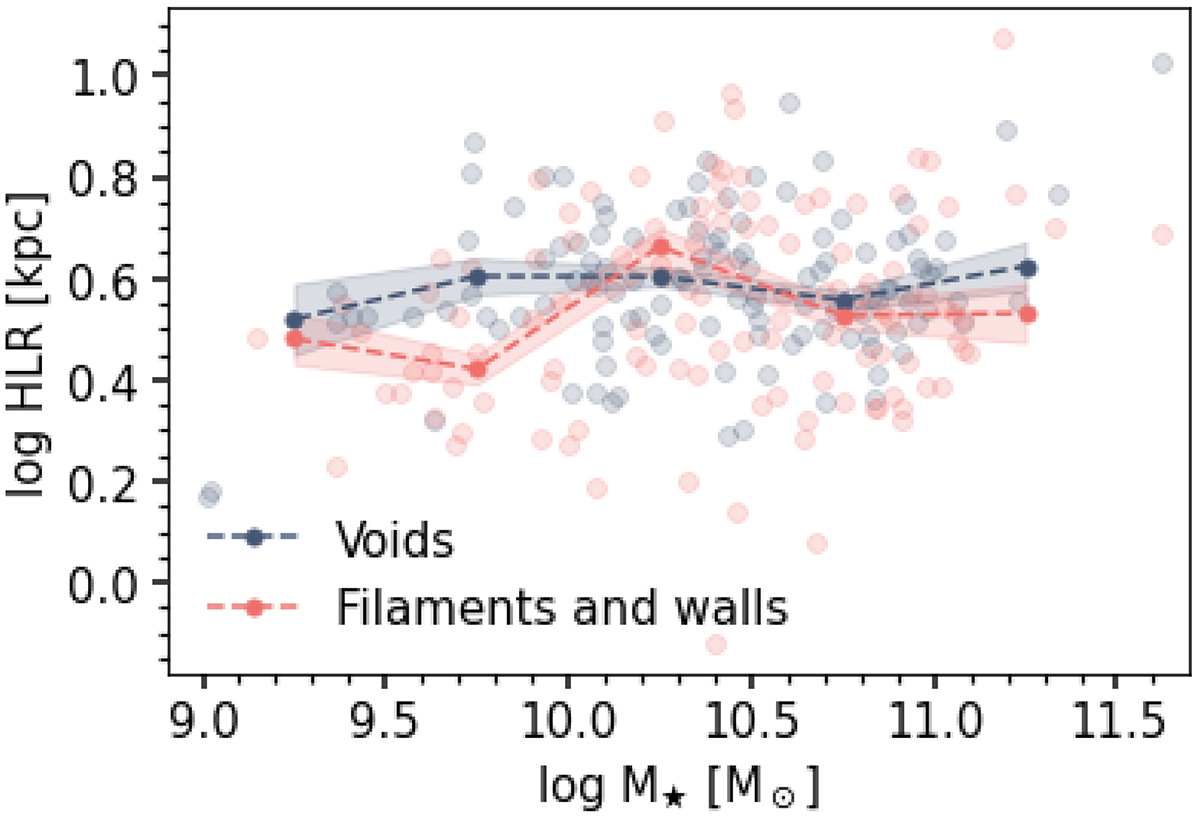
Half-light radius versus total stellar mass for the galaxies in voids (in dark blue) and the galaxies in filaments and walls (red). The darker points connected by dashed lines refer to the median values in bins of stellar mass. The shaded area around them marks the error of the mean (the standard deviation divided by the square root of the number of points in each bin).
Current usage metrics show cumulative count of Article Views (full-text article views including HTML views, PDF and ePub downloads, according to the available data) and Abstracts Views on Vision4Press platform.
Data correspond to usage on the plateform after 2015. The current usage metrics is available 48-96 hours after online publication and is updated daily on week days.
Initial download of the metrics may take a while.