Open Access
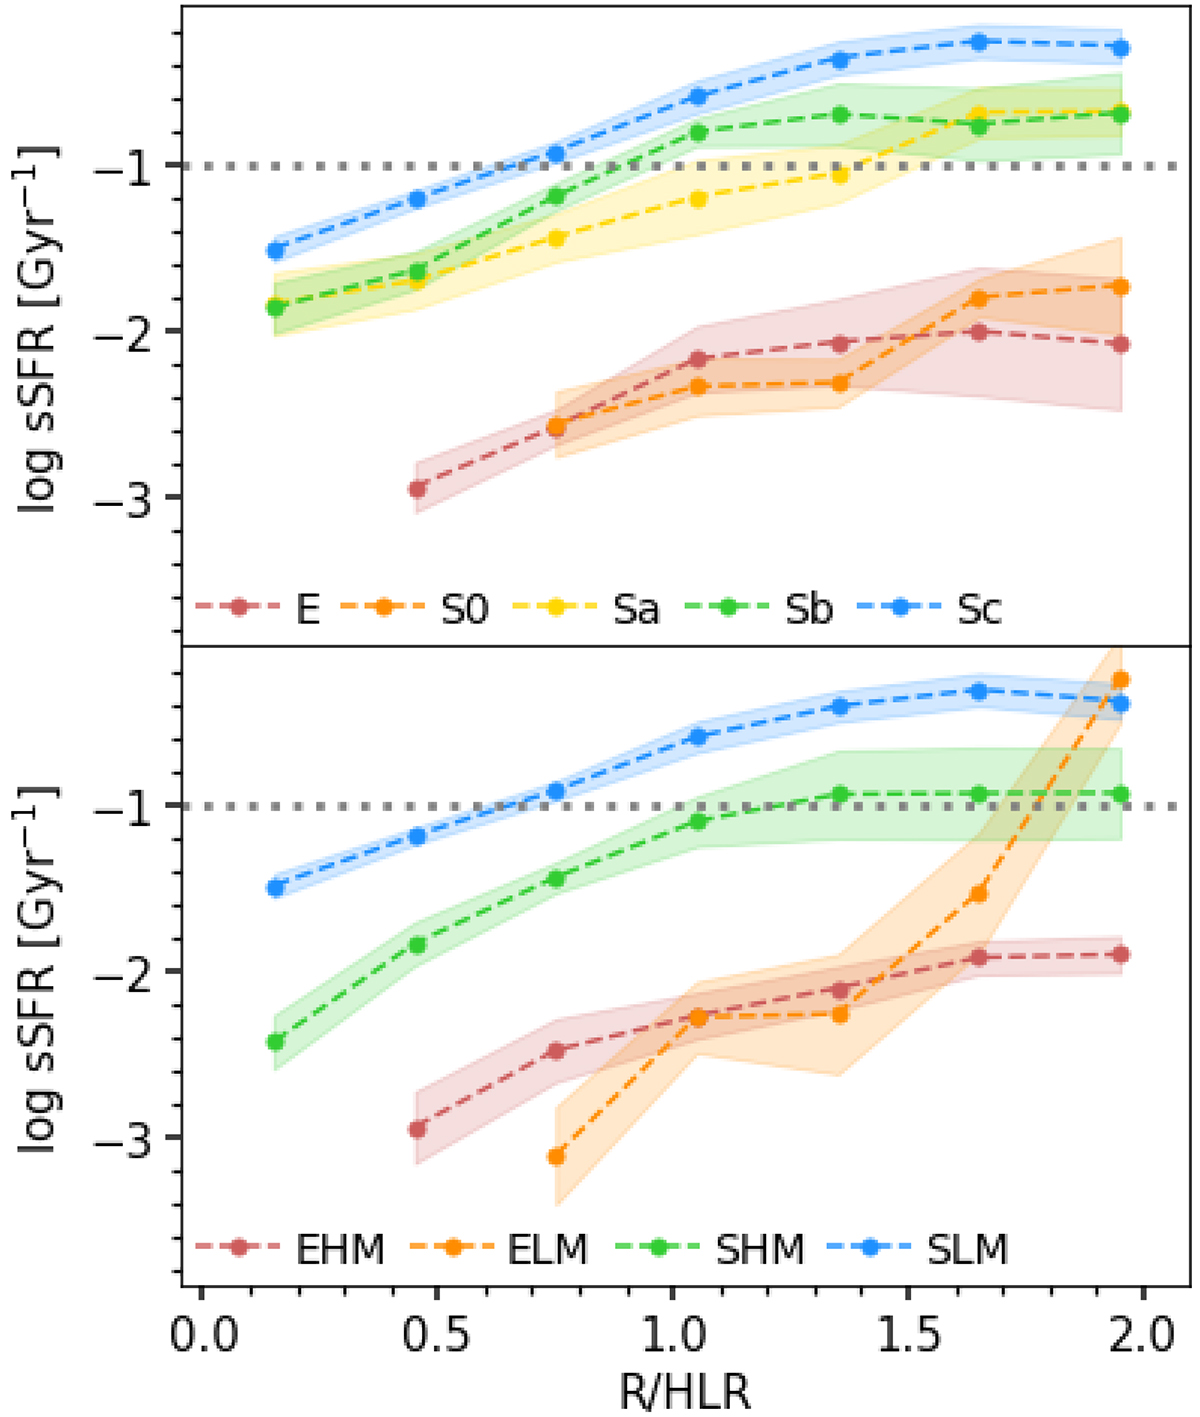
Fig. 13.
Download original image
Radial profiles of the intensity of the specific SFR. The dotted line marks the limit between star-forming and quenched regions, adopted in Peng et al. (2010). Top: stacked radial profiles by morphological type. Bottom: stacked radial profiles in bins of morphology and mass. See Fig. 6 for more details.
Current usage metrics show cumulative count of Article Views (full-text article views including HTML views, PDF and ePub downloads, according to the available data) and Abstracts Views on Vision4Press platform.
Data correspond to usage on the plateform after 2015. The current usage metrics is available 48-96 hours after online publication and is updated daily on week days.
Initial download of the metrics may take a while.