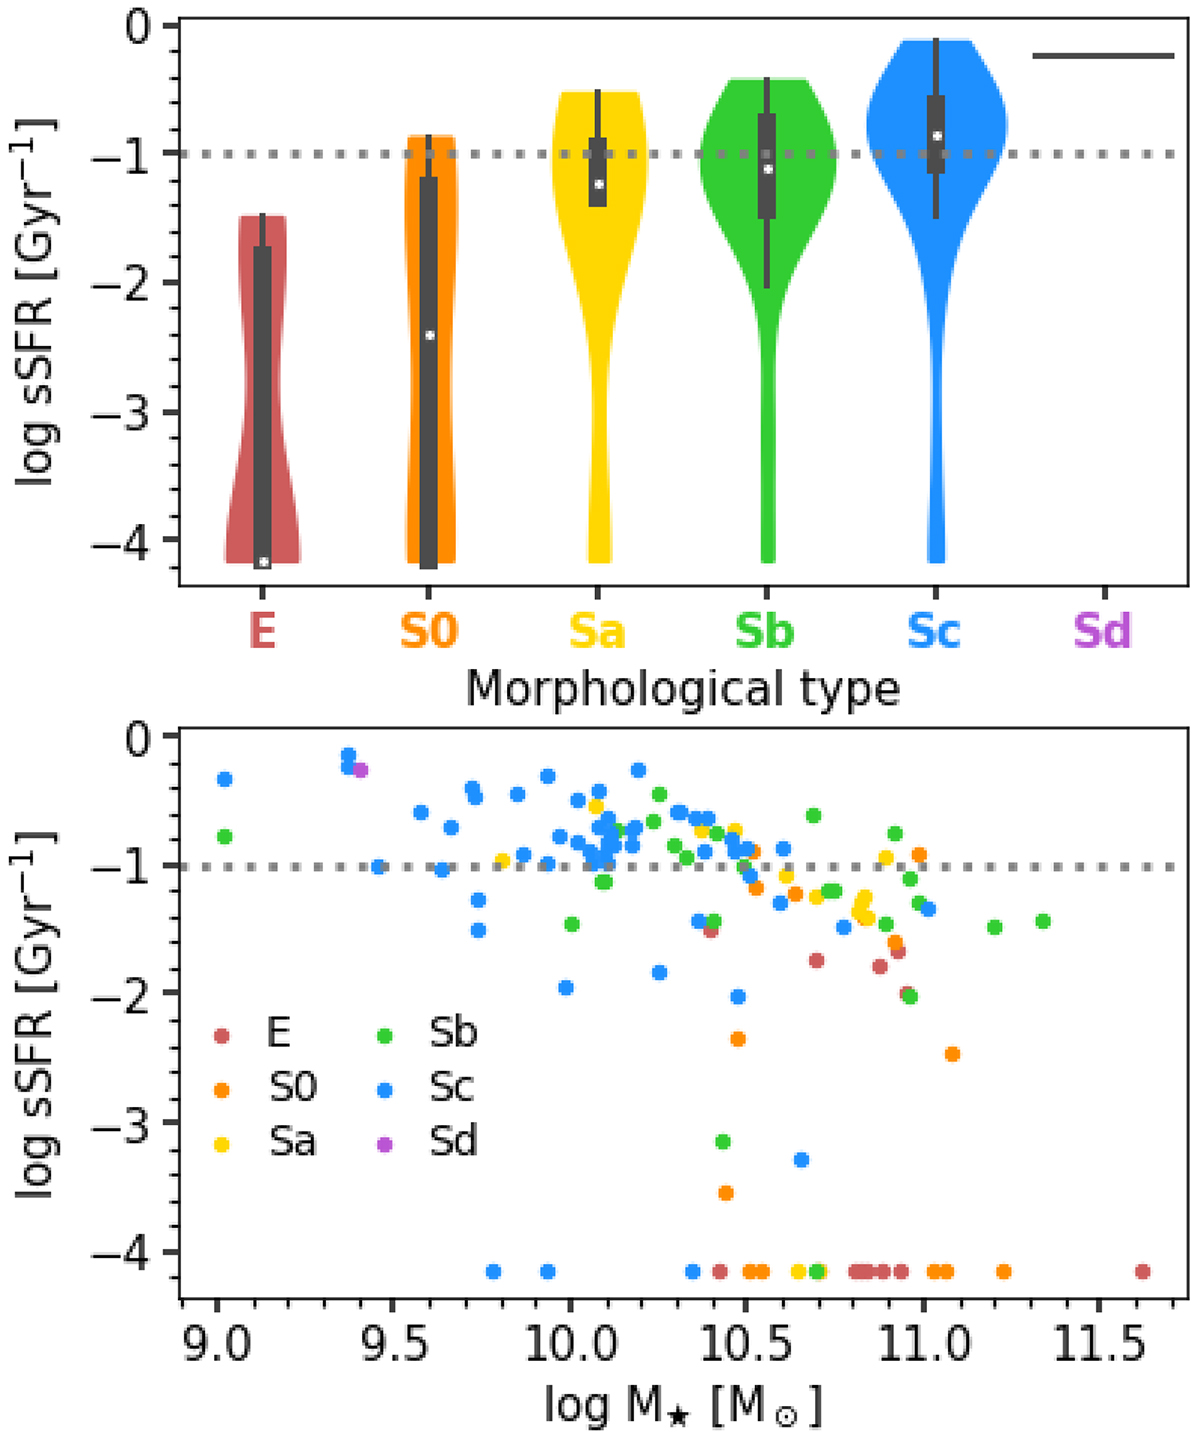
Fig. 12.
Download original image
Global specific SFR. The galaxies with null sSFR were given the value sSFR = 10−4.15 Gyr−1 (the value of the minimum minus the standard deviation) so that they could appear in the plots. The dotted line marks the limit between star-forming and quenched galaxies, adopted in Peng et al. (2010). Top: distribution of the total sSFR for each type (violin plot as in Fig. 4). Bottom: sSFR versus stellar mass.
Current usage metrics show cumulative count of Article Views (full-text article views including HTML views, PDF and ePub downloads, according to the available data) and Abstracts Views on Vision4Press platform.
Data correspond to usage on the plateform after 2015. The current usage metrics is available 48-96 hours after online publication and is updated daily on week days.
Initial download of the metrics may take a while.