Fig. 8
Download original image
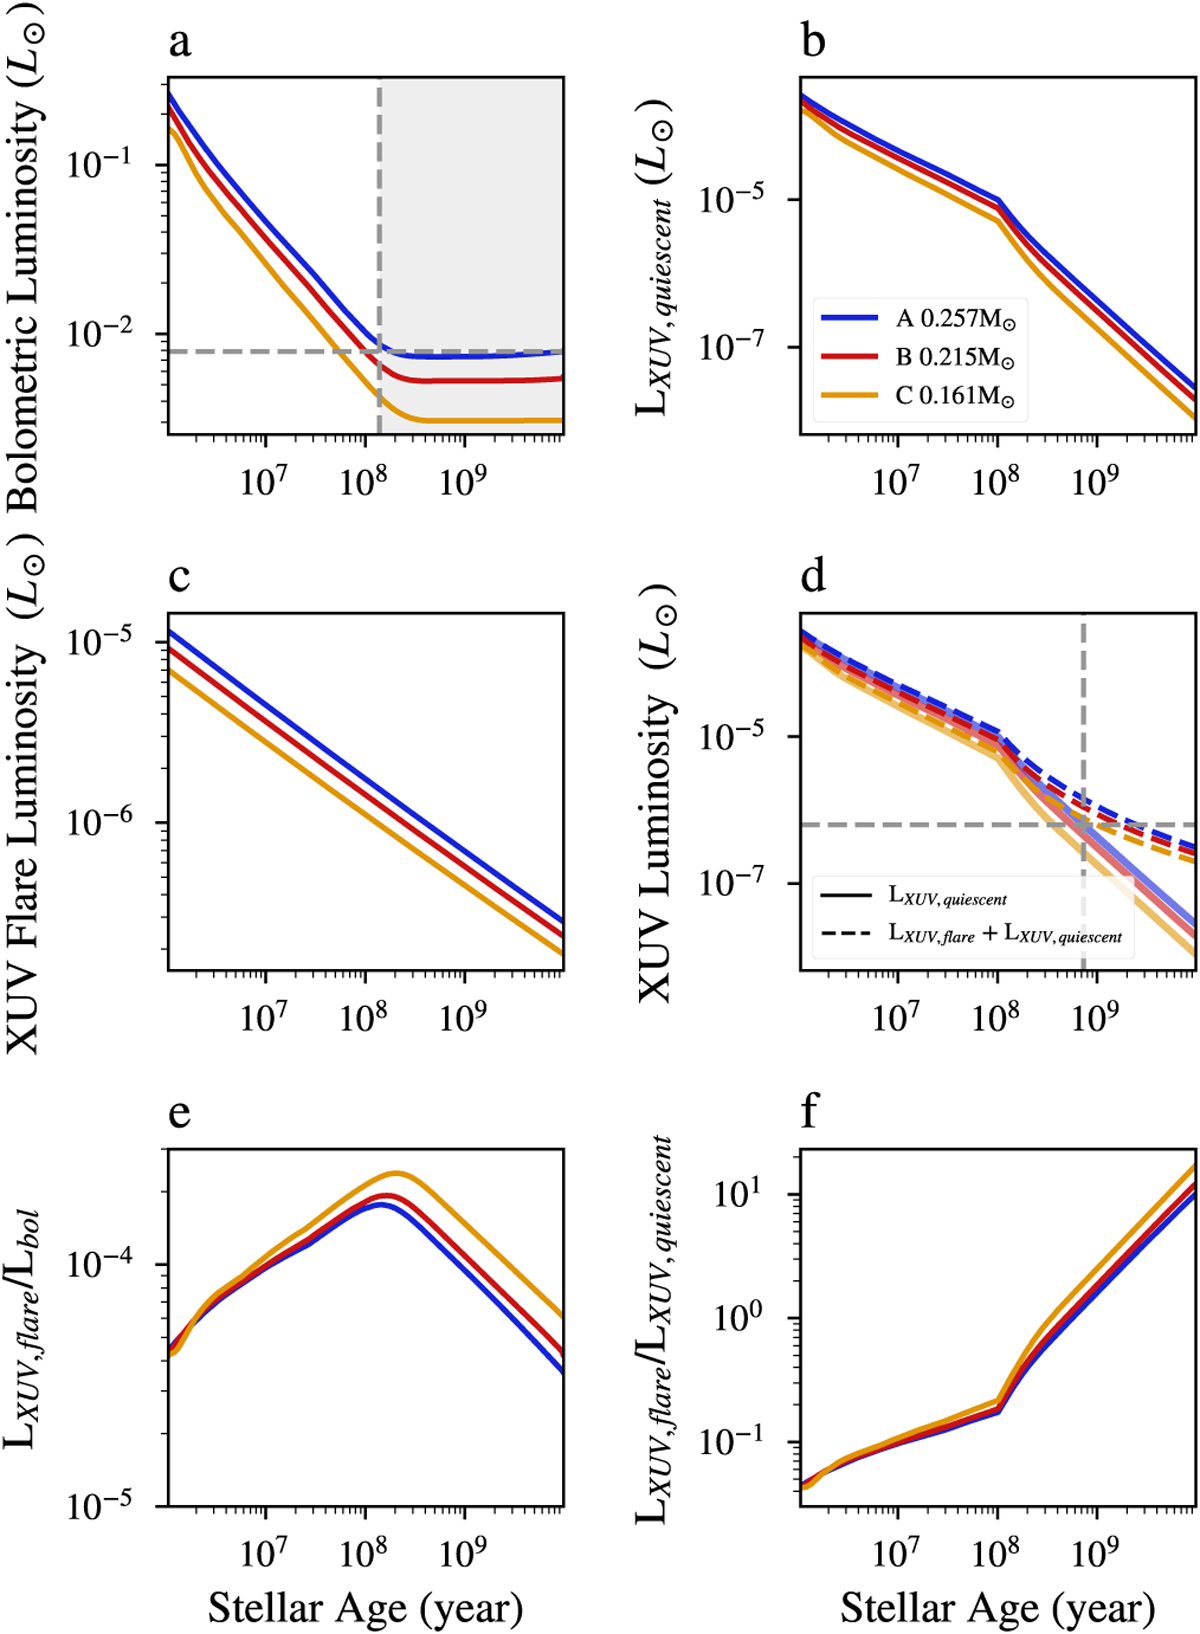
Stellar evolution track based on Baraffe et al. (2015) model of the three stars in the system. Panels a and b display the bolometric luminosity and the XUV quiescent luminosity. The observed bolometric luminosity and XUV luminosity were used to determine the A component. Panels c and d display the XUV luminosity from flares and the total XUV luminosity overlaid by the gray dashed line indicating the average observed X-ray flux + estimated EUV flux in d. The ratio of XUV luminosity from flares to bolometric luminosity is displayed in panel e, and the ratio of XUV luminosity from flares to XUV quiescent luminosity is displayed in panel f.
Current usage metrics show cumulative count of Article Views (full-text article views including HTML views, PDF and ePub downloads, according to the available data) and Abstracts Views on Vision4Press platform.
Data correspond to usage on the plateform after 2015. The current usage metrics is available 48-96 hours after online publication and is updated daily on week days.
Initial download of the metrics may take a while.