Open Access
Fig. 6
Download original image
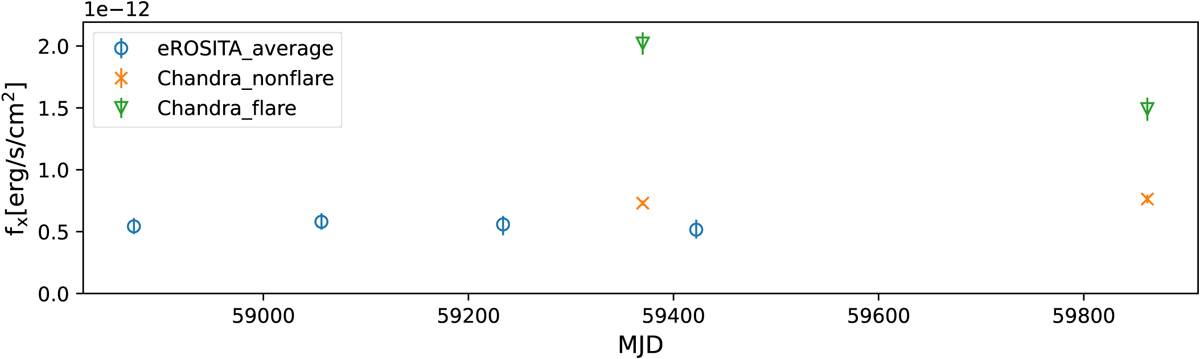
Long-term X-ray variability of the combined BC components. The average flux taken from eROSITA eRASS1:4 (blue) every six months during the years 2020–2021. The Chandra observation from year 2021 was reported in Brown et al. (2022) and year 2022 from this work during the flare (green) and non-flare (orange) time.
Current usage metrics show cumulative count of Article Views (full-text article views including HTML views, PDF and ePub downloads, according to the available data) and Abstracts Views on Vision4Press platform.
Data correspond to usage on the plateform after 2015. The current usage metrics is available 48-96 hours after online publication and is updated daily on week days.
Initial download of the metrics may take a while.