Fig. 5
Download original image
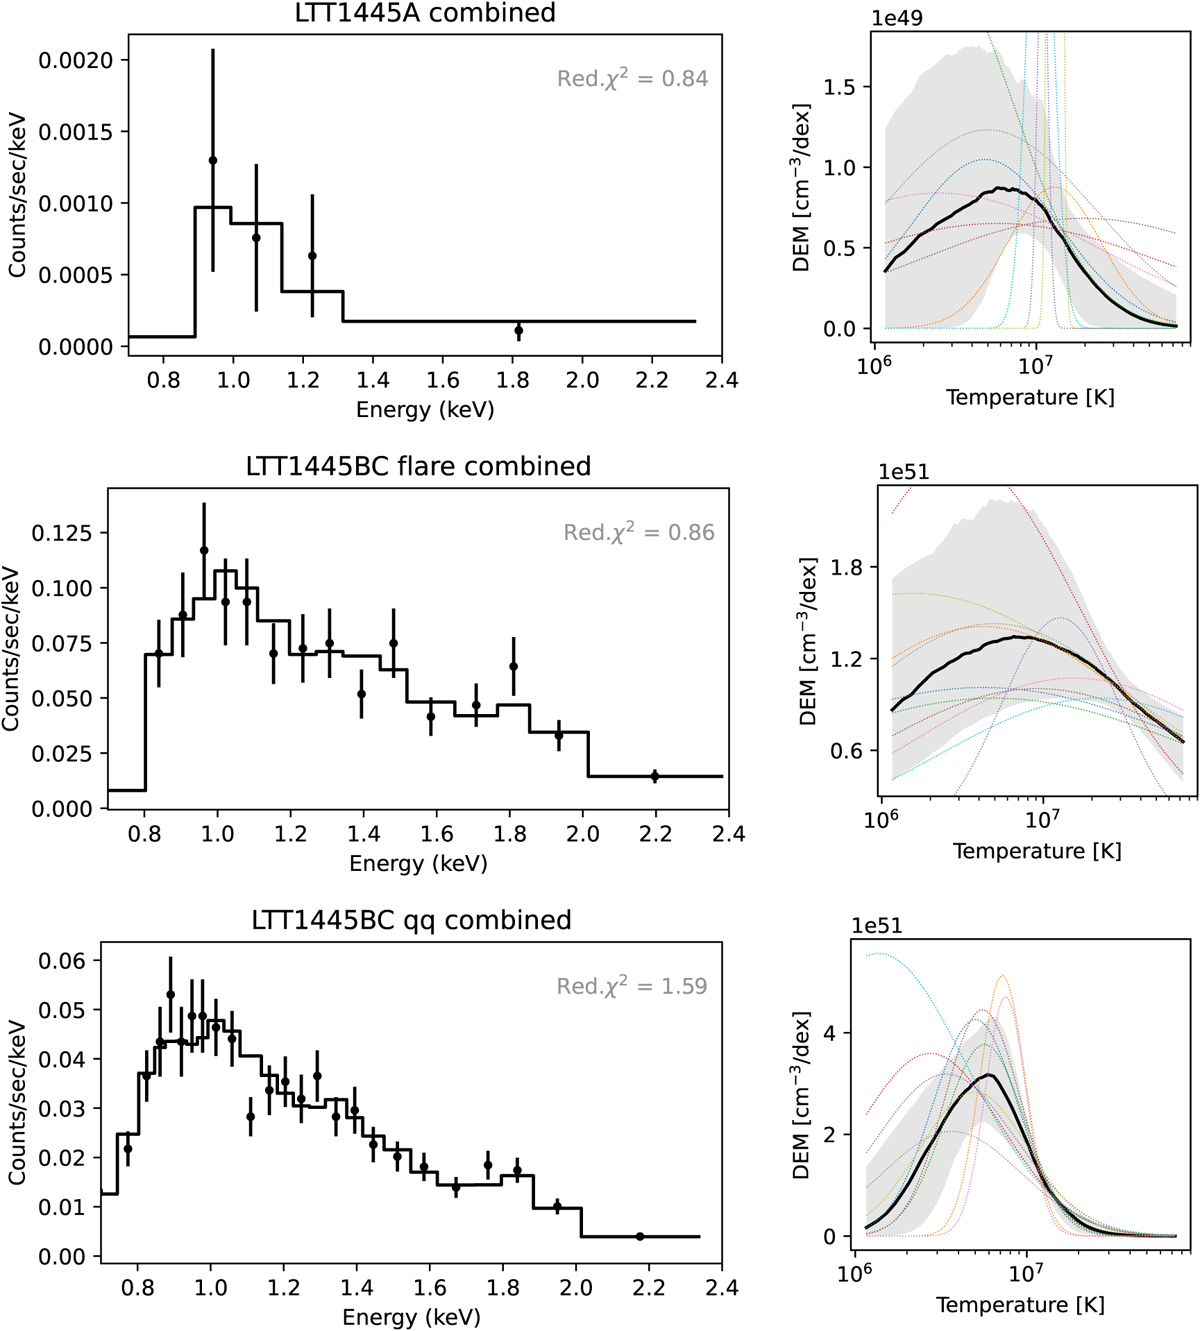
Chandra ACIS spectra of LTT 1445A (left) combined (top) and LTT 1445BC combined flare (middle), and quasi-quiescent (bottom). The corresponding right panels show the reconstructed continuous DEM distribution (approximated with a grid during the fit; see Fig. 4). The black curve shows the median of the posterior DEM predictions and the gray band contains 68% of the distribution. The colorful dotted lines are ten random posterior samples of possible DEM. The top right panel y-axis has a 100 times lower normalization than the lower-right panels. The bottom-right panel displays the DEM, with a narrow shape plummeting at 2 × 10⁷ K, while the middle right panel shows a broad distribution.
Current usage metrics show cumulative count of Article Views (full-text article views including HTML views, PDF and ePub downloads, according to the available data) and Abstracts Views on Vision4Press platform.
Data correspond to usage on the plateform after 2015. The current usage metrics is available 48-96 hours after online publication and is updated daily on week days.
Initial download of the metrics may take a while.