Fig. 6
Download original image
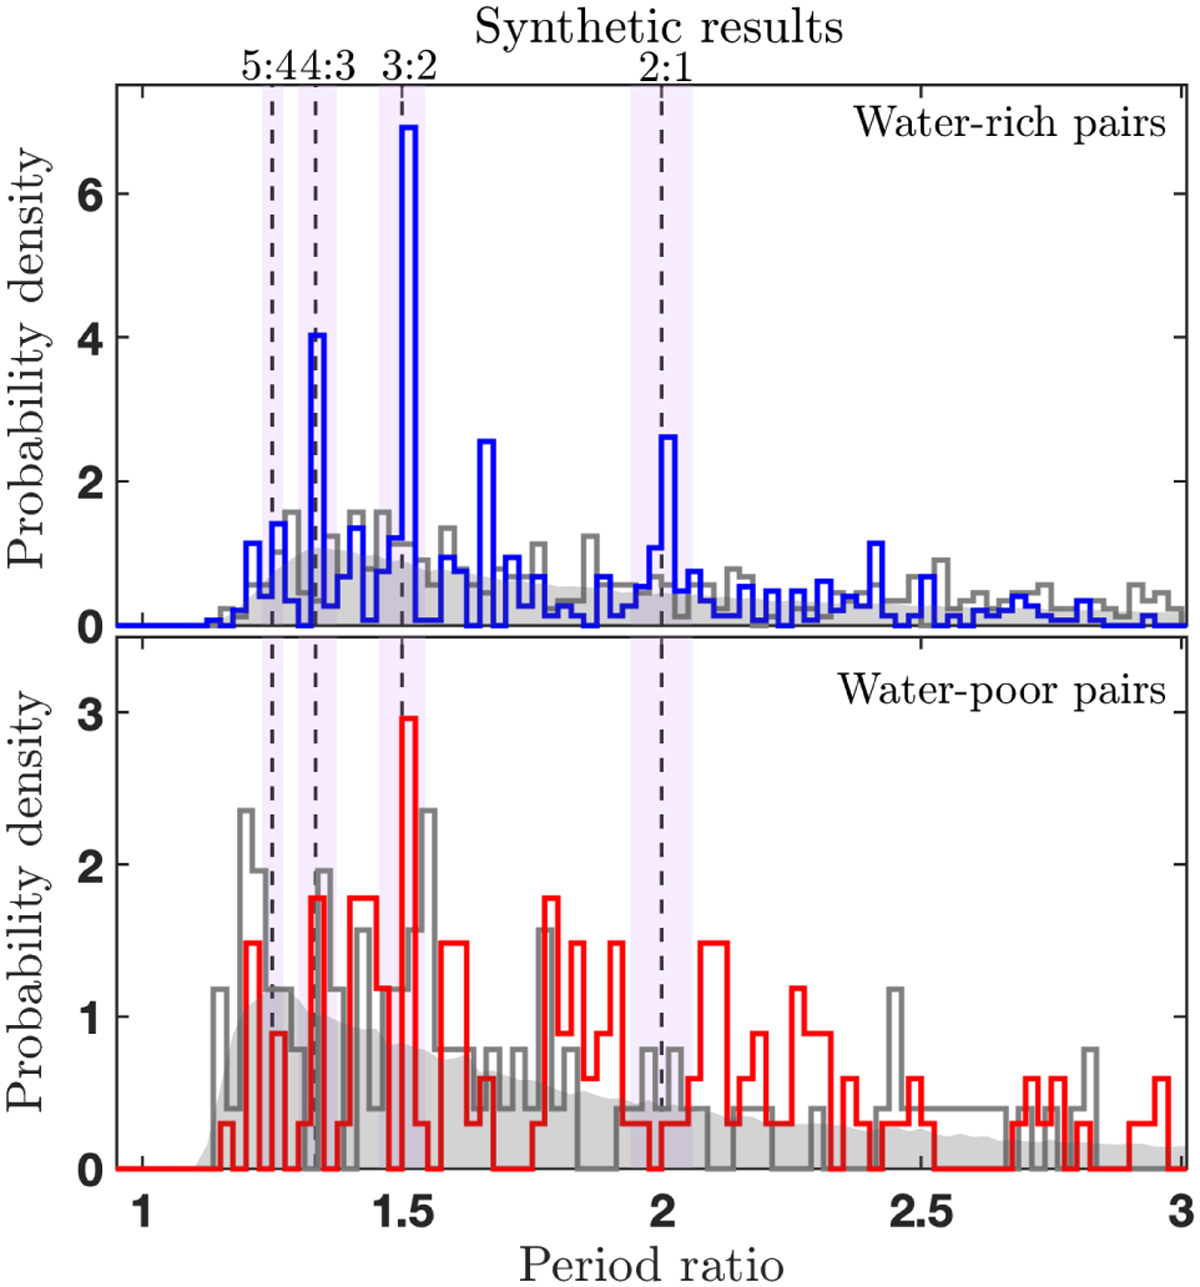
Probability density functions of period ratios of adjacent water-rich (top panel) and water-poor (bottom panel) planet pairs derived from the synthetic sample and the corresponding control sample with the assumption that planets are randomly paired (grey). The grey regions and lines represent the control sample by combining the 1000 times of randomly pairing and one example with similar fractions in near-first-order MMRs in the 1000 sets, respectively.
Current usage metrics show cumulative count of Article Views (full-text article views including HTML views, PDF and ePub downloads, according to the available data) and Abstracts Views on Vision4Press platform.
Data correspond to usage on the plateform after 2015. The current usage metrics is available 48-96 hours after online publication and is updated daily on week days.
Initial download of the metrics may take a while.