Open Access
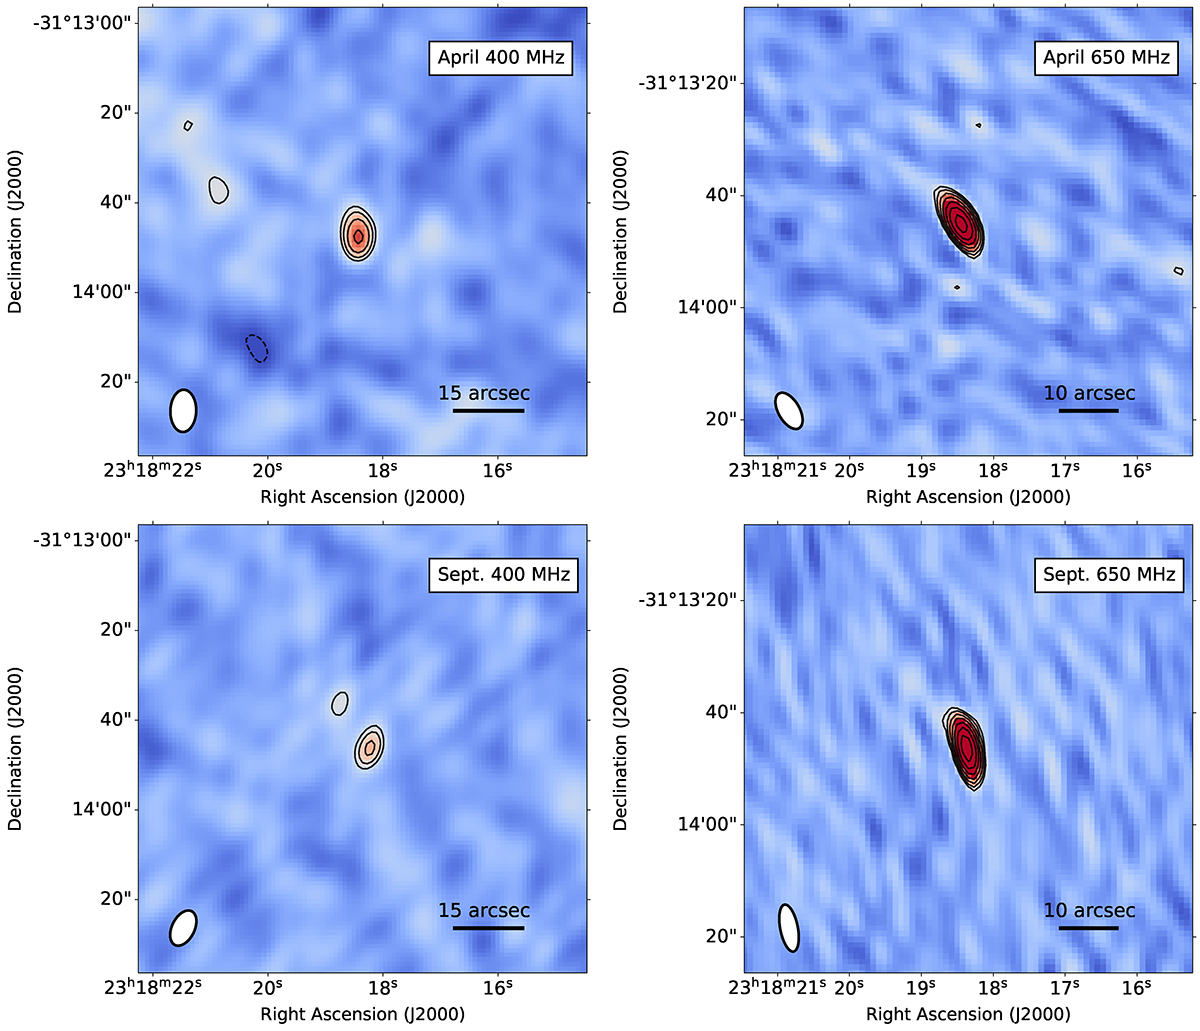
Fig. A.2.
Download original image
uGMRT observation of VIK J2318−31 at 400 (left) and 650 MHz (right) at the two different epochs: April 2022 (top) and September 2022 (bottom). Contours start at ±3×RMS and increase by a factor of ![]() .
.
Current usage metrics show cumulative count of Article Views (full-text article views including HTML views, PDF and ePub downloads, according to the available data) and Abstracts Views on Vision4Press platform.
Data correspond to usage on the plateform after 2015. The current usage metrics is available 48-96 hours after online publication and is updated daily on week days.
Initial download of the metrics may take a while.