Fig. 6.
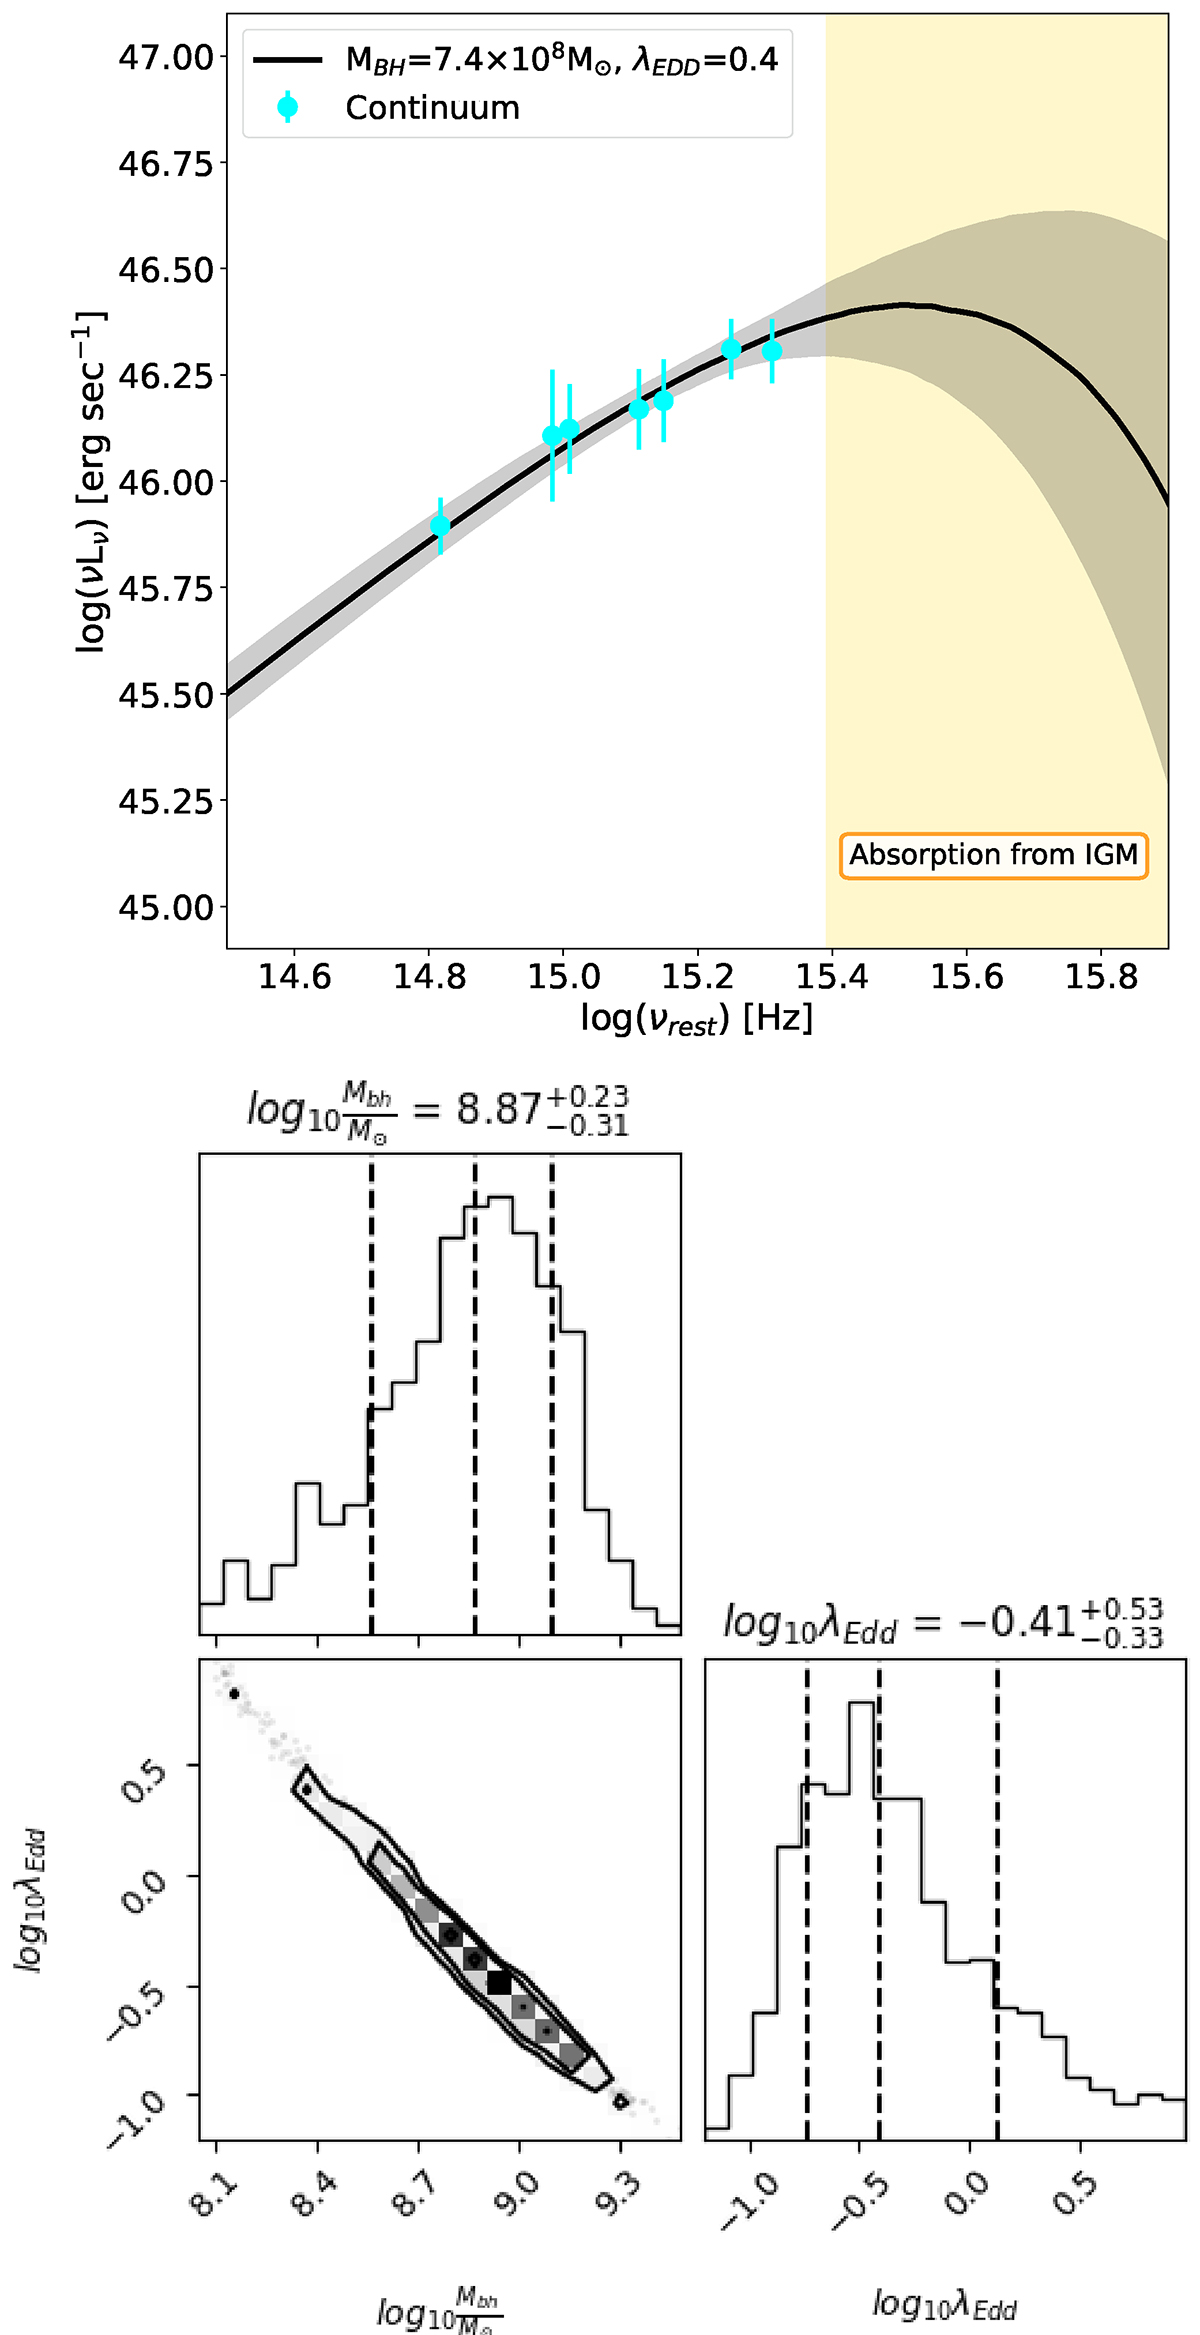
Download original image
Accretion disc model fit to the optical/NIR emission of VIK J2318−31. Top panel: rest-frame optical-UV luminosities of VIK J2318−31 (cyan points) together with the best-fit SS AD model (solid black line). The shaded blue area represents the model within the 16th and 84th percentiles. The hatched yellow region at ν > 3.3 × 10¹⁵ Hz indicates frequencies higher than the Lyα emission line, which not accessible at high redshift due to the absorption from the IGM. Bottom panels: corner plot with the posterior distributions of the parameters used in the fit. Dashed vertical lines indicate the 16th, 50th and 84th percentiles.
Current usage metrics show cumulative count of Article Views (full-text article views including HTML views, PDF and ePub downloads, according to the available data) and Abstracts Views on Vision4Press platform.
Data correspond to usage on the plateform after 2015. The current usage metrics is available 48-96 hours after online publication and is updated daily on week days.
Initial download of the metrics may take a while.