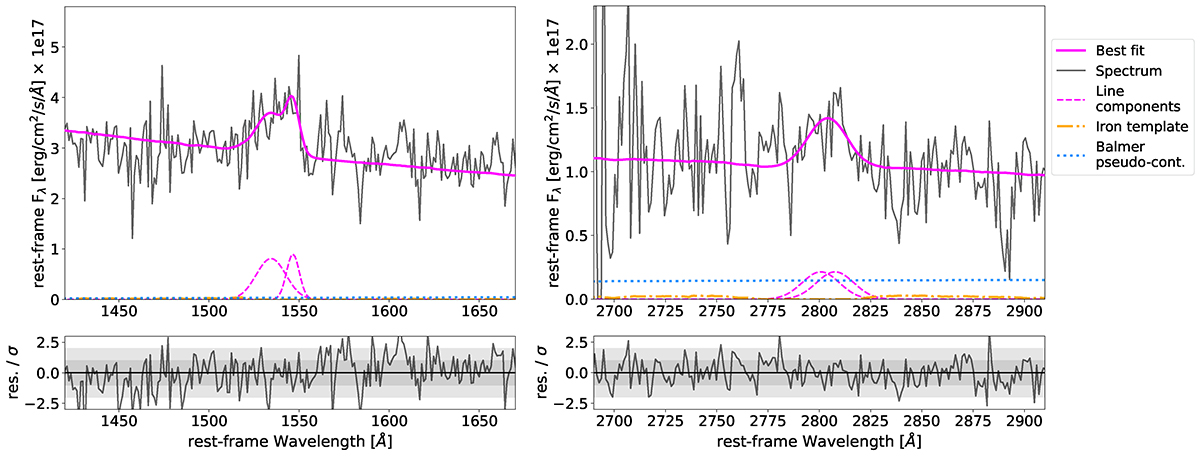
Fig. 5.
Download original image
Analysis of the broad emission lines in VIK J2318−31. Top panels: zoomed-in view of the rest-frame CIV (left) and MgII (right) emission lines of VIK J2318−31. The grey line shows the rest-frame spectrum. The best-fit, continuum plus emission lines, is shown as a solid magenta line. In both cases we used two Gaussian components (dashed magenta lines), but in the case of the MgII line we fixed the width and the normalisation of the components to be equal and the relative position of the peaks to 7.2 Å. The Balmer and the iron pseudo-continuum contributions are shown as a dotted blue line and a dashed-dotted orange line, respectively. Bottom panels: residual of the fit divided by the error on the spectrum at each wavelength. Shaded areas indicate ±1,2σ.
Current usage metrics show cumulative count of Article Views (full-text article views including HTML views, PDF and ePub downloads, according to the available data) and Abstracts Views on Vision4Press platform.
Data correspond to usage on the plateform after 2015. The current usage metrics is available 48-96 hours after online publication and is updated daily on week days.
Initial download of the metrics may take a while.