Fig. 4.
Download original image
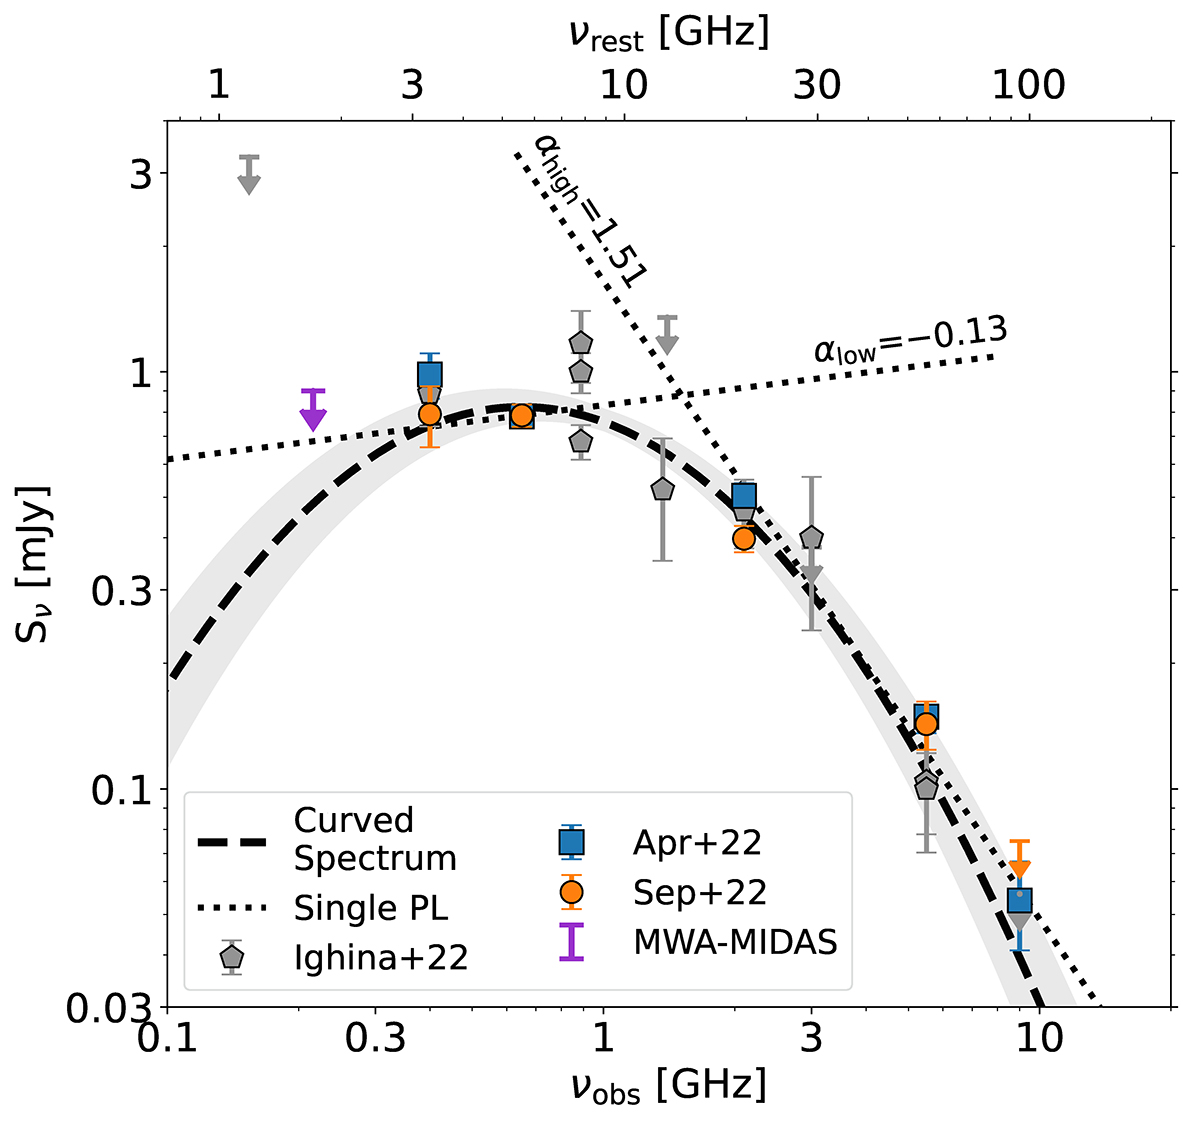
Radio spectrum of VIK J2318−31. Data already presented in Ighina et al. (2022a) are shown as grey pentagons, while new observations are reported as blue squares (April epoch) and orange circles (September epoch). The purple upper-limit is the estimate derived from the new MWA-MIDAS image. The dashed black line shows the best-fit curved spectrum described in the text. The shaded grey area encloses the curves obtained by varying the best-fit parameters by ±1σ. The dashed line shows the best-fit double power law, while the dotted lines are the best-fit single power law describing the data above and below 1.4 GHz in the observed frame.
Current usage metrics show cumulative count of Article Views (full-text article views including HTML views, PDF and ePub downloads, according to the available data) and Abstracts Views on Vision4Press platform.
Data correspond to usage on the plateform after 2015. The current usage metrics is available 48-96 hours after online publication and is updated daily on week days.
Initial download of the metrics may take a while.