Fig. 3.
Download original image
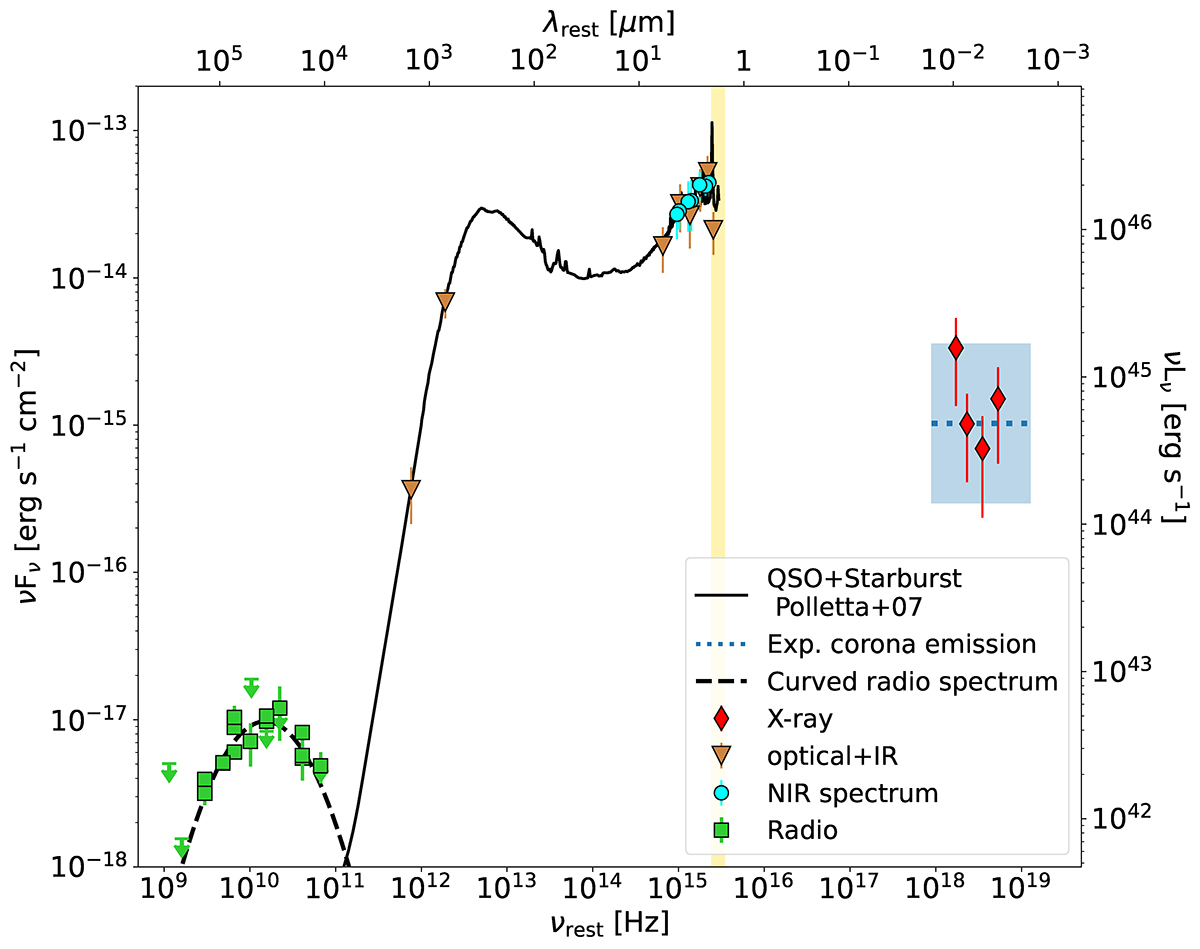
Rest-frame spectral energy distribution, from the radio to the X-ray band, of VIK J2318−31. Radio data are reported as green squares together with the best-fit curved radio spectrum derived (dashed black line); optical and IR data from the literature are reported as brown inverted triangles, while the photometric points used for the AD model are reported as cyan circles; the X-ray Chandra data are reported as red diamonds together with the expected X-ray emission from the LX−L2500 Å relation derived in Lusso & Risaliti (2016) (assuming Γ = 2; blue shaded region). The shaded yellow area represents the range of optical frequencies where the Lyα absorption from the intergalactic medium takes place.
Current usage metrics show cumulative count of Article Views (full-text article views including HTML views, PDF and ePub downloads, according to the available data) and Abstracts Views on Vision4Press platform.
Data correspond to usage on the plateform after 2015. The current usage metrics is available 48-96 hours after online publication and is updated daily on week days.
Initial download of the metrics may take a while.