Fig. 1.
Download original image
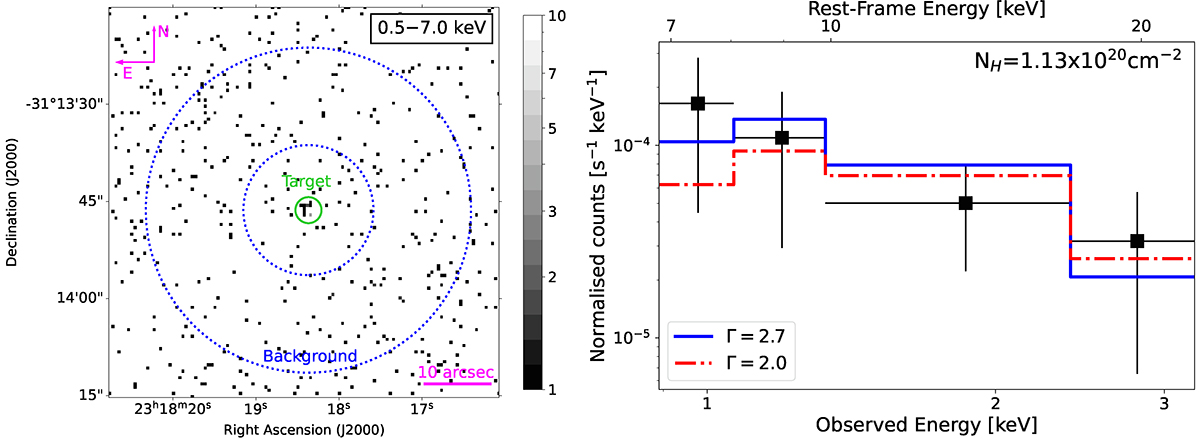
X-ray observations of VIK J2318−31. Left: X-ray image of VIK J2318−31 from a 70 ks Chandra observation. The extraction region for the target and background spectra are reported as a solid green circle and a dotted blue annulus. Right: X-ray spectrum of VIK J2318−31. The best-fit power law spectra obtained using the cstat statistics are reported as a solid blue line (with Γ as a free parameter) and as a dashed-dotted red line (with Γ fixed). The corresponding best-fit values are reported in Table 1.
Current usage metrics show cumulative count of Article Views (full-text article views including HTML views, PDF and ePub downloads, according to the available data) and Abstracts Views on Vision4Press platform.
Data correspond to usage on the plateform after 2015. The current usage metrics is available 48-96 hours after online publication and is updated daily on week days.
Initial download of the metrics may take a while.