Open Access
Fig. 9.
Download original image
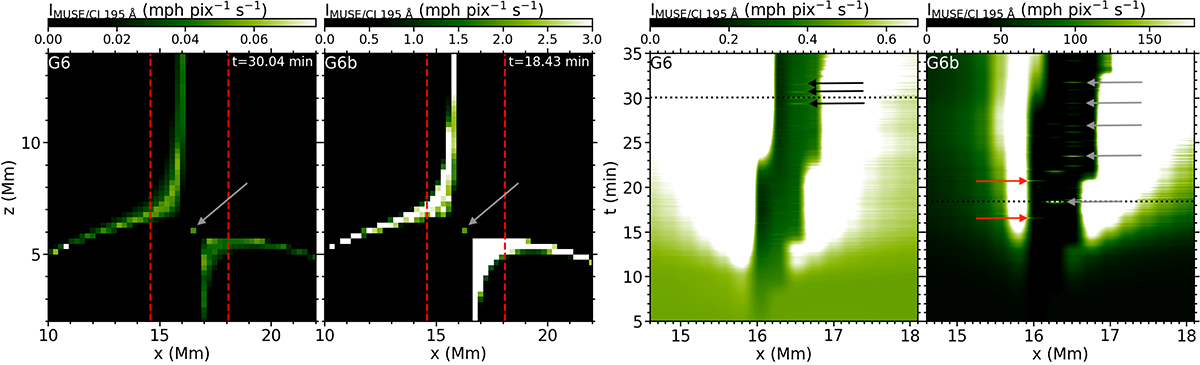
Synthetic MUSE/CI 195 Å response for the simulations G6 and G6b as seen off-limb (two leftmost panels) and on-disk (two rightmost panels). Layout is the same as for Fig. 3, with the addition of arrows pointing at the location of some plasmoids: red ones for those upward-moving; black or grey for downward-moving.
Current usage metrics show cumulative count of Article Views (full-text article views including HTML views, PDF and ePub downloads, according to the available data) and Abstracts Views on Vision4Press platform.
Data correspond to usage on the plateform after 2015. The current usage metrics is available 48-96 hours after online publication and is updated daily on week days.
Initial download of the metrics may take a while.