Fig. 3.
Download original image
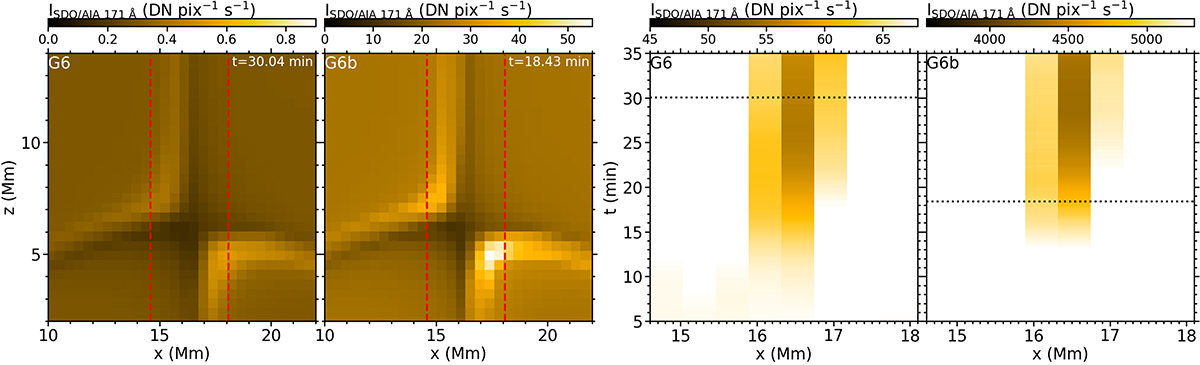
Synthetic SDO/AIA 171 Å response for the simulations G6 and G6b as seen off-limb (two leftmost panels) and on-disk (two rightmost panels). The red dashed lines in the two leftmost panels delimit the x-range for the other two panels. The black dotted line in the two rightmost panels marks the time shown in the two leftmost panels.
Current usage metrics show cumulative count of Article Views (full-text article views including HTML views, PDF and ePub downloads, according to the available data) and Abstracts Views on Vision4Press platform.
Data correspond to usage on the plateform after 2015. The current usage metrics is available 48-96 hours after online publication and is updated daily on week days.
Initial download of the metrics may take a while.