Fig. C.1
Download original image
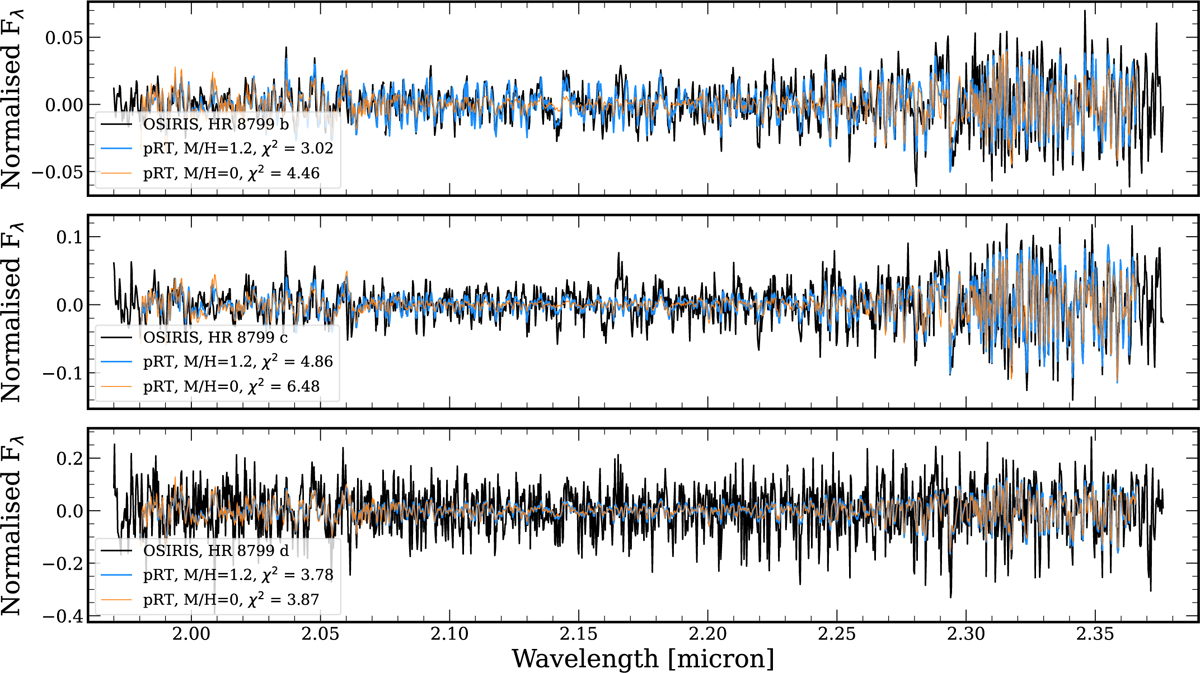
Comparison of best-fit disequilibrium models to OSIRIS data from Ruffio et al. (2021). From top to bottom is HR 8799 b, c, and d. In blue are the best-fit disequilibrium models, with the spectra generated using high-resolution line-by-line opacities, before being convolved, binned, and normalised for comparison. In orange is the same, but with the metallicity set to 0.
Current usage metrics show cumulative count of Article Views (full-text article views including HTML views, PDF and ePub downloads, according to the available data) and Abstracts Views on Vision4Press platform.
Data correspond to usage on the plateform after 2015. The current usage metrics is available 48-96 hours after online publication and is updated daily on week days.
Initial download of the metrics may take a while.