Fig. 15
Download original image
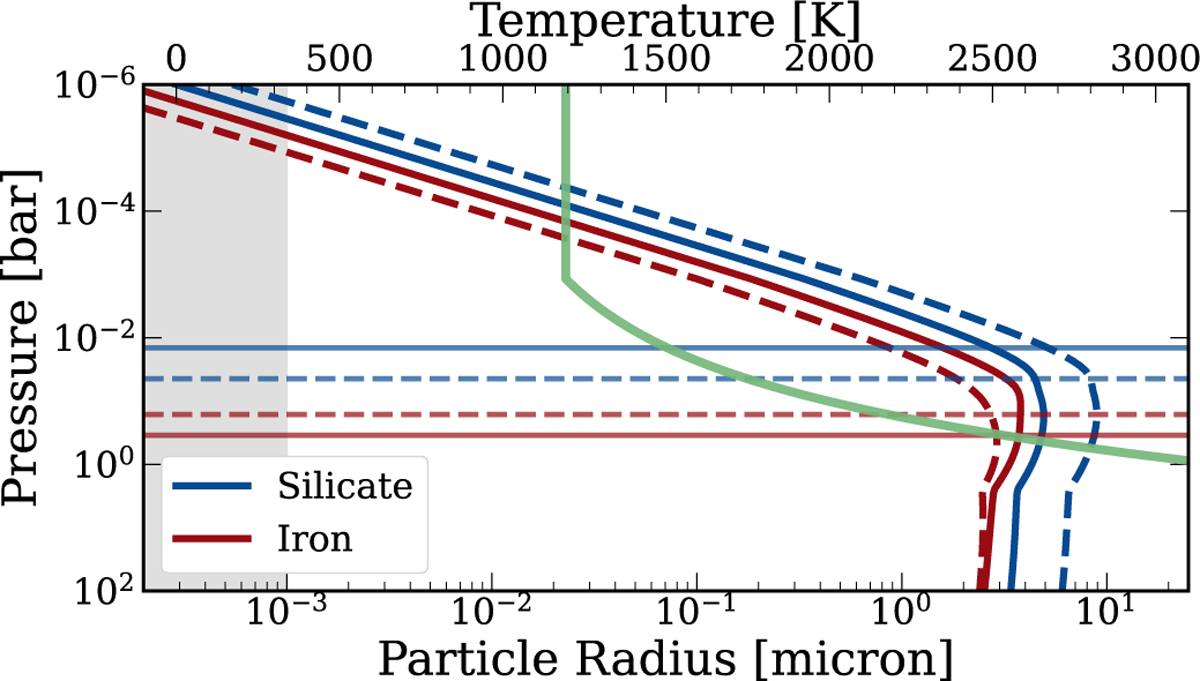
Effective particle radii as a function of altitude for silicate (blue) and iron (red) clouds. The solid lines indicate the radii for Case e.AB.13, which used a free cloud base pressure and abundance, while the dashed lines are for Case e.AB.2, which used equilibrium condensation and scaled equilibrium abundances. The horizontal lines indicate the cloud base pressure. The green line indicates the temperature profile. The shaded regions indicate unphysical particle sizes where the opacity contribution is set to 0.
Current usage metrics show cumulative count of Article Views (full-text article views including HTML views, PDF and ePub downloads, according to the available data) and Abstracts Views on Vision4Press platform.
Data correspond to usage on the plateform after 2015. The current usage metrics is available 48-96 hours after online publication and is updated daily on week days.
Initial download of the metrics may take a while.