Fig. 14
Download original image
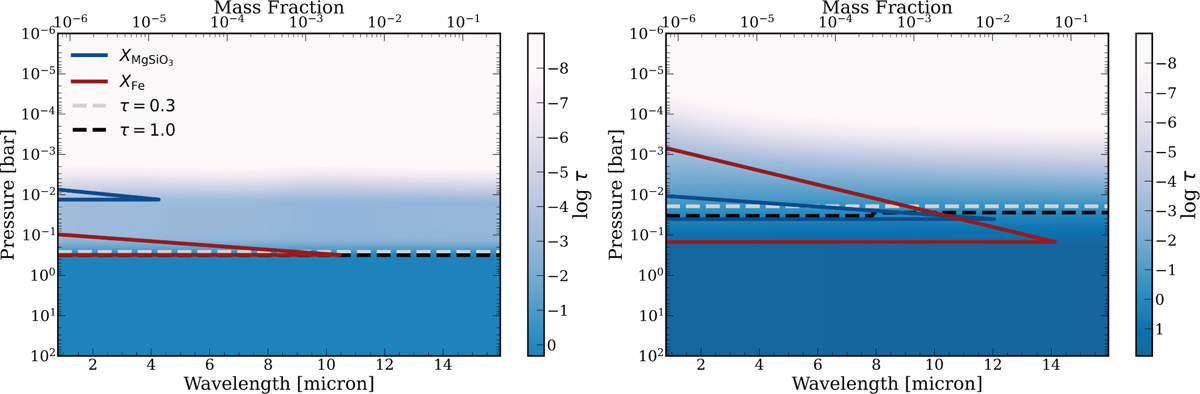
Cloud properties for HR 8799 e, showing the optical depth due to clouds as a function of pressure (colour map), with the τ = 0.3 and τ = 1.0 contours highlighted by the dashed lines. The solid lines indicate the mass fraction abundance of the MgSiO3 and Fe clouds in blue and red respectively. Left: cloud properties e.AB.13, using a freely retrieved cloud base pressure and abundances. Right: the same, but for Case e.AB.2, which uses the equilibrium condensation to determine the location of the cloud base. The abundances are determined using equilibrium chemistry, and retrieving a scaling factor, (log SFe = 0.0 ± 1.1, log ![]() = −0.8 ± 1.0).
= −0.8 ± 1.0).
Current usage metrics show cumulative count of Article Views (full-text article views including HTML views, PDF and ePub downloads, according to the available data) and Abstracts Views on Vision4Press platform.
Data correspond to usage on the plateform after 2015. The current usage metrics is available 48-96 hours after online publication and is updated daily on week days.
Initial download of the metrics may take a while.