Fig. 11
Download original image
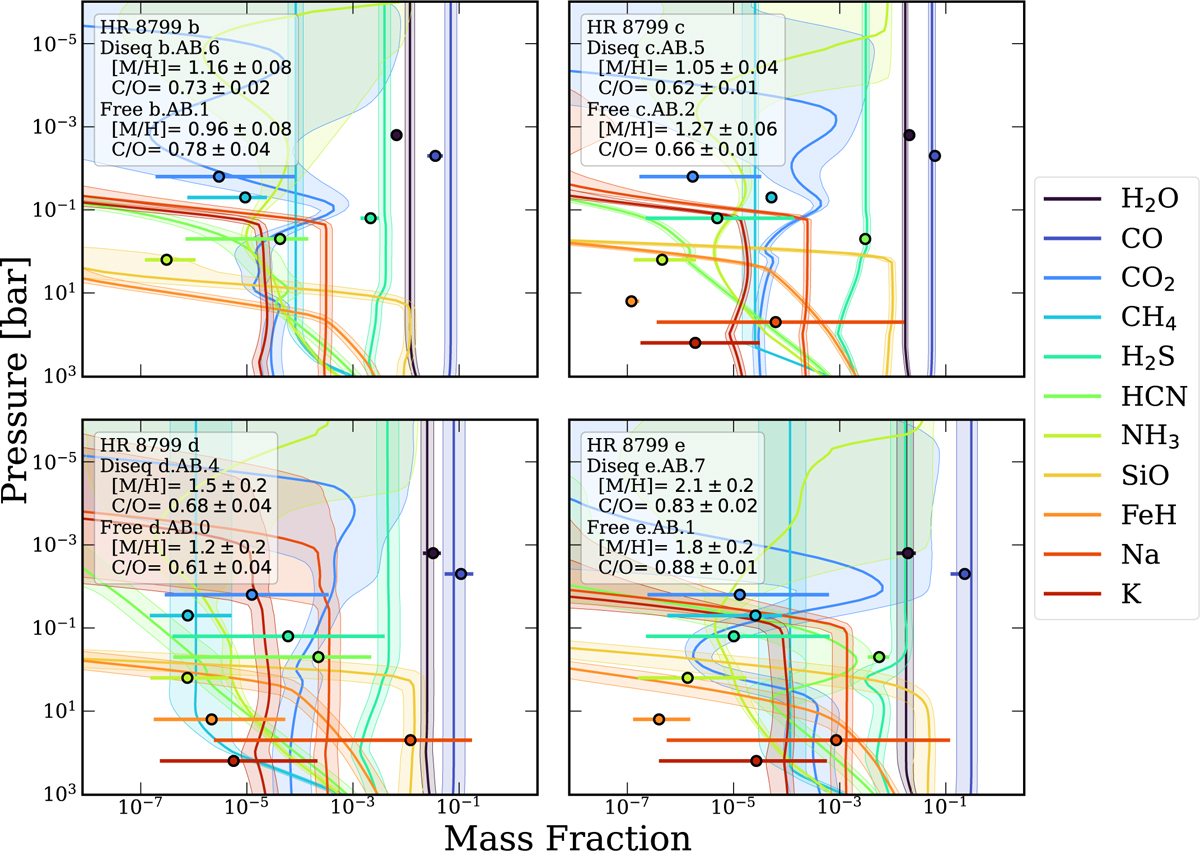
Mass fraction abundance profiles as a function of pressure in the atmospheres of HR 8799 b, c, d, and e. The solid lines indicate the median values of the most favoured disequilibrium retrieval for each planet, with the shaded region indicating the 90% confidence interval. The circular markers show the median values for each species from the most favoured free chemistry retrieval, with the error bars indicating the 90% confidence interval. The position along the pressure axis is arbitrary. The minimum mass fraction allowed in the free retrievals was 10−7.
Current usage metrics show cumulative count of Article Views (full-text article views including HTML views, PDF and ePub downloads, according to the available data) and Abstracts Views on Vision4Press platform.
Data correspond to usage on the plateform after 2015. The current usage metrics is available 48-96 hours after online publication and is updated daily on week days.
Initial download of the metrics may take a while.