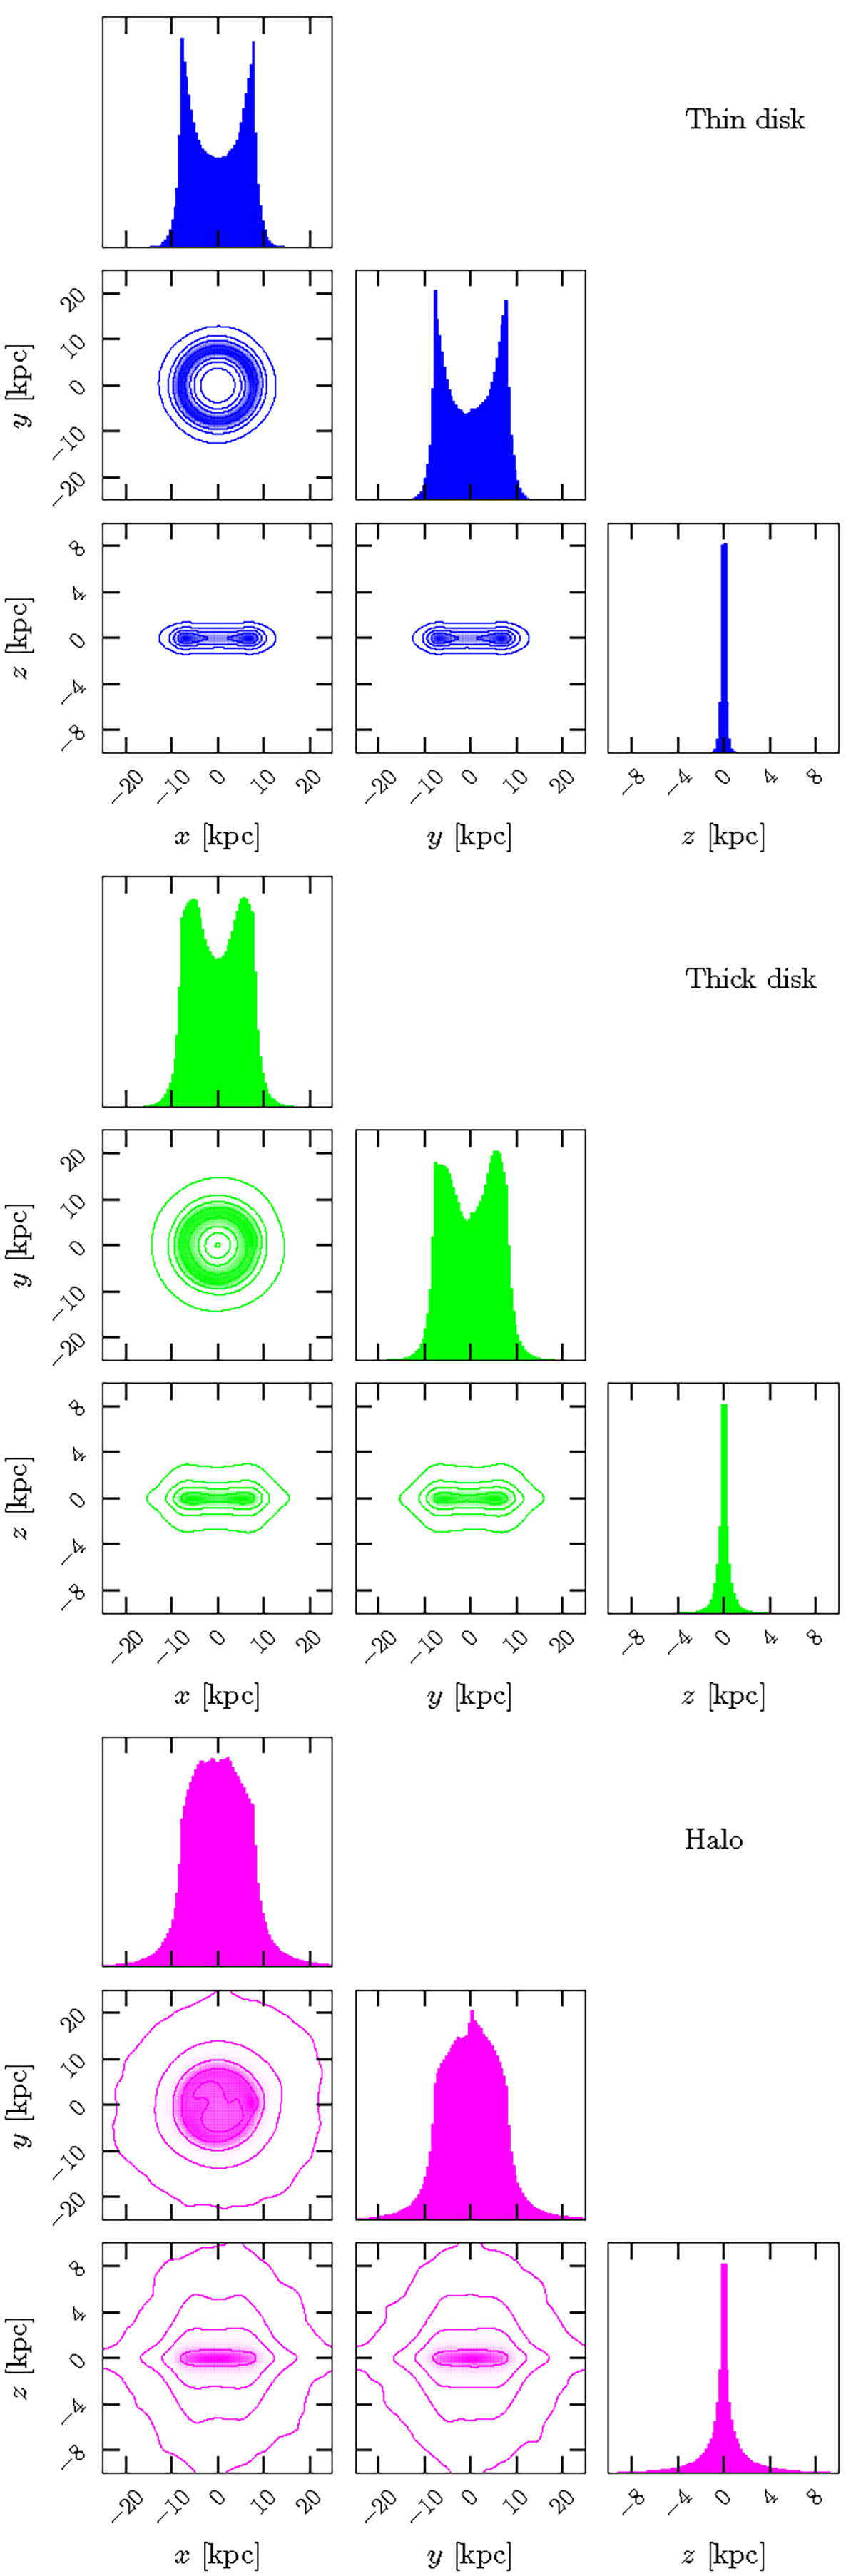
Fig. 2.
Download original image
Corner plots showing the spatial distribution of integrated orbits of the simulated populations in Galactocentric Cartesian coordinates; from top to bottom, we display the thin-disk, thick-disk, and halo samples, respectively. The density contours delimit the 1, 3, and 5σ levels and the 99th percentile of the 2D distributions.
Current usage metrics show cumulative count of Article Views (full-text article views including HTML views, PDF and ePub downloads, according to the available data) and Abstracts Views on Vision4Press platform.
Data correspond to usage on the plateform after 2015. The current usage metrics is available 48-96 hours after online publication and is updated daily on week days.
Initial download of the metrics may take a while.