Fig. 7.
Download original image
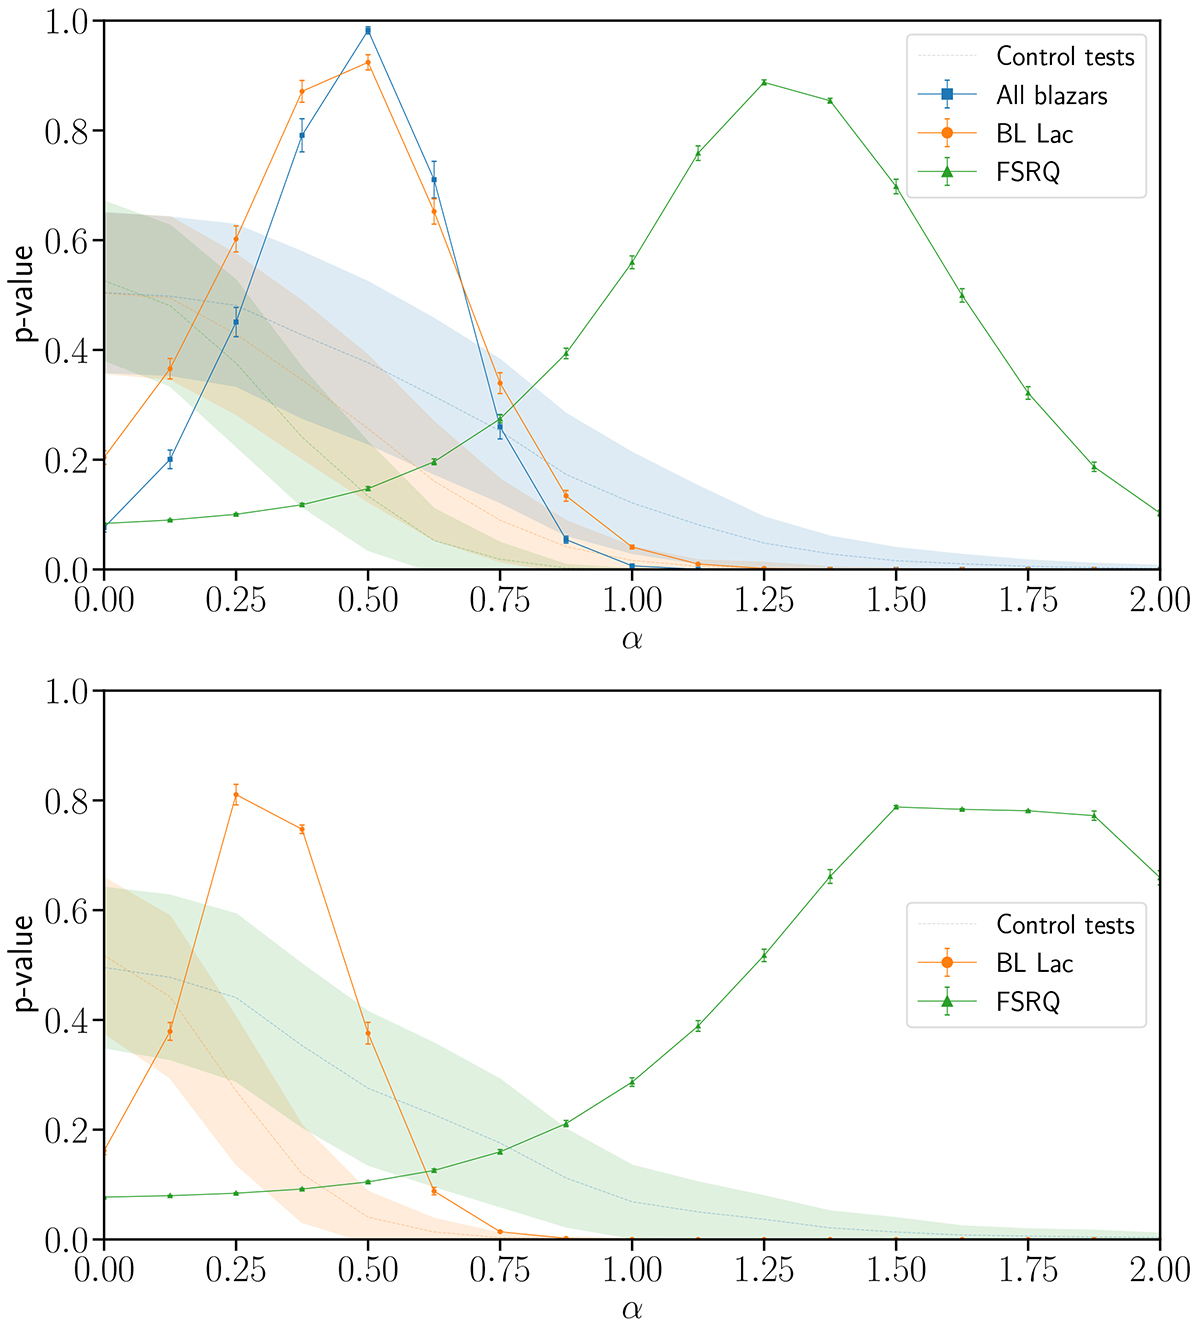
p-values from the K − S tests as a function of the index α from Eq. (1). The solid lines show the results for each class of sampled neutrino blazar candidates. The error bars show the standard deviation of each p-value after repeating the test 103 times for each α. The dashed lines show the results for the test performed on the control samples with shaded areas indicating the 1σ uncertainty regions from the N = 1000 Monte Carlo samples drawn for each α and source class. The upper panel shows the results from T1 (gamma-ray energy flux as proxy for the luminosity), while the lower panel shows the results from T2 (using only sources with known redshift).
Current usage metrics show cumulative count of Article Views (full-text article views including HTML views, PDF and ePub downloads, according to the available data) and Abstracts Views on Vision4Press platform.
Data correspond to usage on the plateform after 2015. The current usage metrics is available 48-96 hours after online publication and is updated daily on week days.
Initial download of the metrics may take a while.