Fig. 5.
Download original image
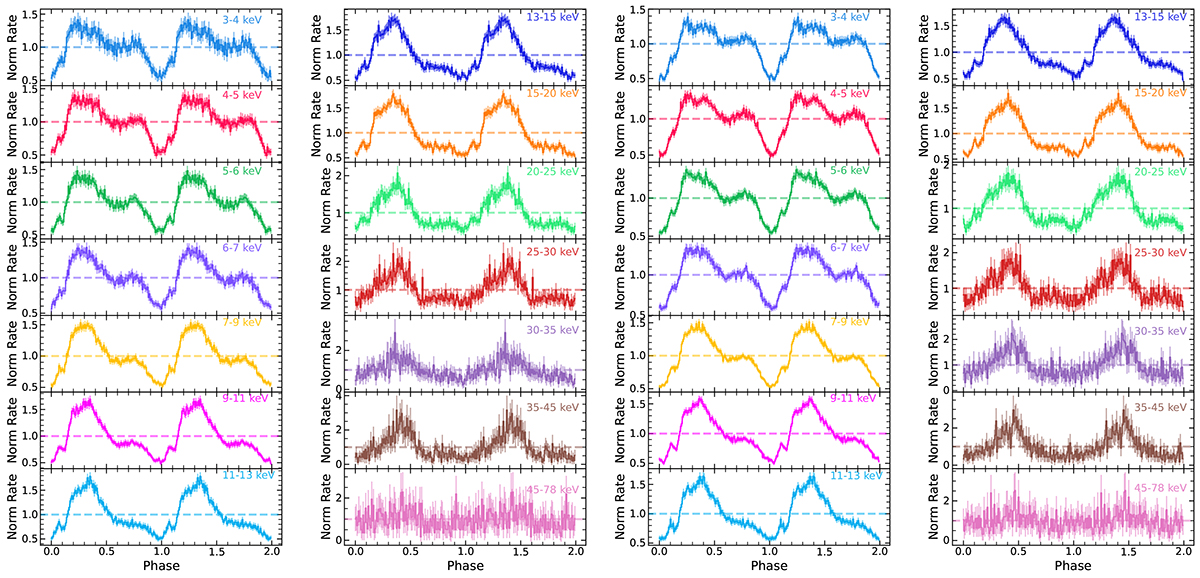
Pulse profiles of Cen X-3 in different energy bands. The left two panels show the energy-resolved pulse profiles for Cen X-3 from the summations of the FPMA and FPMB counts in MJD 59593.12 (the time interval k of the first orbit) at low intensity state and the right two panels show the energy-resolved pulse profiles in MJD 59594.67 (the time interval g of the second orbit) at high intensity state.
Current usage metrics show cumulative count of Article Views (full-text article views including HTML views, PDF and ePub downloads, according to the available data) and Abstracts Views on Vision4Press platform.
Data correspond to usage on the plateform after 2015. The current usage metrics is available 48-96 hours after online publication and is updated daily on week days.
Initial download of the metrics may take a while.