Fig. 6
Download original image
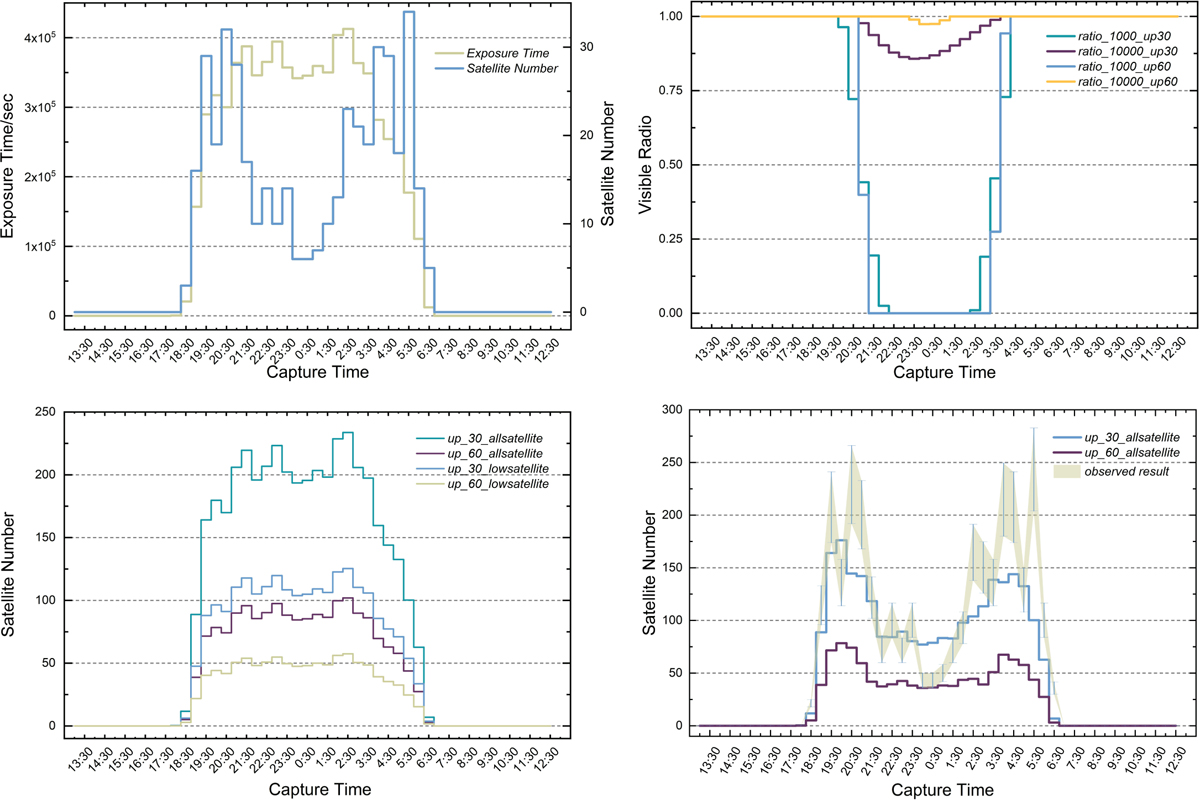
Intermediate results of data processing and the comparison of our model’s results with observed results. The top-left subplot illustrates the distribution of observation time of LAMOST, which amounts to 991 949.625 seconds, as well as the distribution of the 427 satellite trails. The bottom-left subplot illustrates the time distribution of the number of observable satellites under different observation modes. This analysis, based on the results from Table 2, incorporates the distribution of observation time of the telescope and the number of times the telescope changed observation targets (the number of times the observation sky area was changed). However, it does not consider whether satellites can be illuminated by the Sun. The top-right plot depicts the time distribution of satellite visibility on March 15, 2023 for satellites at altitudes of 1000 km and 10 000 km. It considers satellites within the range of elevation angles greater than 30 degrees and those within the range of elevation angles greater than 60 degrees. The bottom-right plot compares the predictions of the model, which takes into account whether satellites can be illuminated by the Sun, with the observed results.
Current usage metrics show cumulative count of Article Views (full-text article views including HTML views, PDF and ePub downloads, according to the available data) and Abstracts Views on Vision4Press platform.
Data correspond to usage on the plateform after 2015. The current usage metrics is available 48-96 hours after online publication and is updated daily on week days.
Initial download of the metrics may take a while.