Fig. 9.
Download original image
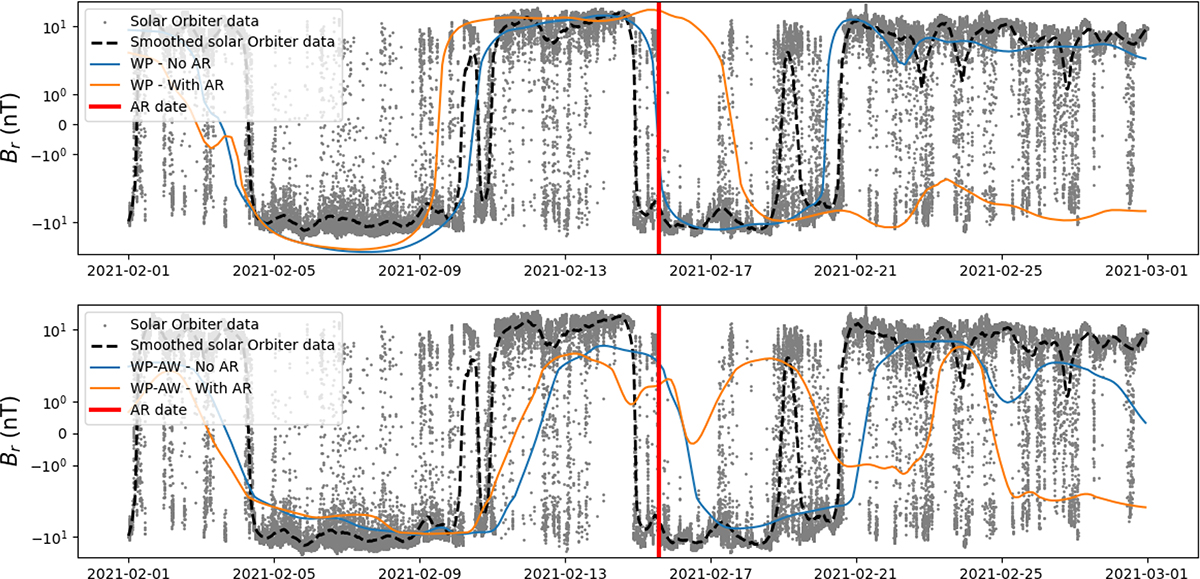
Comparison between Solar Orbiter/MAG measured radial field and predictions for the WP model (top panel) and the WP-AW model (bottom panel). The magnetic field corresponding to the simulation performed using the magnetic map from February 15 without the far-side AR is shown in blue, while the one using the magnetic map from February 22 with the far-side AR is shown in orange. For context, we show the data over the full month of February 2021 (in gray), as well as their smoothing (in black dashed line). We also indicate the date of the emergence of the far-side AR with a vertical red line.
Current usage metrics show cumulative count of Article Views (full-text article views including HTML views, PDF and ePub downloads, according to the available data) and Abstracts Views on Vision4Press platform.
Data correspond to usage on the plateform after 2015. The current usage metrics is available 48-96 hours after online publication and is updated daily on week days.
Initial download of the metrics may take a while.